In Part Three of this series, we discussed the redirection of web server log files and the customization of log formats. We also explored log rotation and covered some available logging transport options for consolidating logging data.
However, in a common application architecture, you run many instances or unique applications. Managing and using the log data becomes a challenge if you take an individual approach to log streams, trying to integrate logs from each application or resource into greater monitoring and observability processes.
In this post, we explore practically how to handle your Apache web server logs as part of a consolidated logging architecture with a unified logging layer. With this example architecture, we show how to integrate Apache web server logs with syslog and how CrowdStrike Falcon® LogScale uses all the collected data to provide analytics and visualization of your log data.
Learn More
- Part 1: The Basics
- Part 2: Advanced Concepts
- Part 3: Advanced Logging Options
- Part 4: Ingesting Logs with Syslog
Centralizing All Logs
A centralized logging architecture collects, stores and consolidates log data from multiple hosts into a single repository where it can be stored and analyzed further. With the centralization of all your log data, the management and analysis of logs become more efficient. The computation required to parse, normalize and generate metrics is completed on your central logging server.
A centralized logging architecture has several advantages:
- This log data consolidation helps organizations identify trends, troubleshoot issues and monitor systems and applications more effectively.
- The storage of your log data becomes easier for administrators.
- With a single integration point where logs get saved to permanent storage, your organization will reduce costs and complications associated with backing up and retaining log data over time.
Additional features — such as querying, alerting and notifications — become much easier when log data is stored centrally.
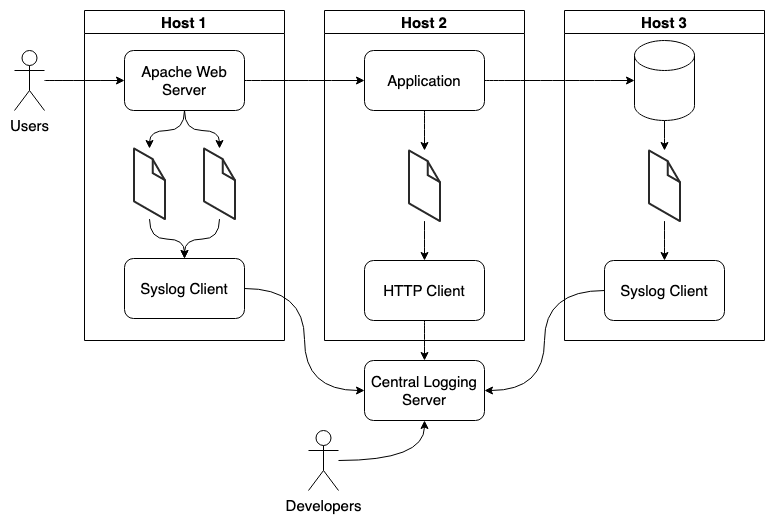
Relying on the capacity of your centralized logging system to receive and understand different logging protocols gives applications or instances the ability to mix and match their logging implementations based on their needs.
The above diagram illustrates how each host is able to implement a different logging client, allowing for a more flexible logging architecture that easily accommodates new log sources as new applications are developed or updated.
Additionally, a centralized logging architecture allows for better security and compliance. This architecture will store all your log data in a single location, applying security policies or access control measures to that log data.
Transporting Logs with Syslog
Let’s implement a simple example that integrates the Apache web server with syslog as our central logging server. To do this, we’ll use Docker Compose to set up two Apache web server containers that push their logs to a central syslog master server (which is also running as a container).
If this is your first time setting up this tool, view the Docker installation instructions to install both the Docker container runtime and the Docker Compose CLI.
The Docker Compose tool
Below is the docker-compose.yml file that defines all the containers in our example. In this example, we use syslog-ng as the logging server, implementing a widespread syslog client and server protocol.
version: '3.9'services:
syslog-ng:
image: balabit/syslog-ng:3.38.1
container_name: syslog-master
ports:
- "514:514/udp"
volumes:
- "./logs:/var/log/syslog-ng"
- "./syslog-ng.conf/:/etc/syslog-ng/syslog-ng.conf"
apache-foo:
image: httpd:latest
container_name: apache-foo
ports:
- '8080:80'
depends_on:
- syslog-ng
logging:
driver: syslog
options:
syslog-address: "udp://127.0.0.1:514"
apache-bar:
image: httpd:latest
container_name: apache-bar
ports:
- '8090:80'
depends_on:
- syslog-ng
logging:
driver: syslog
options:
syslog-address: "udp://127.0.0.1:514"
Both of the defined Apache web servers use the built-in Docker syslog logging driver to use the syslog protocol and automatically forward the container's runtime logs to the syslog-ng container at the address udp://127.0.0.1:514.
The defined syslog-ng server container will mount the syslog-ng.conf file in the same folder in which we execute the Docker-compose command. Below are the contents of the syslog-ng.conf file. We configure syslog-ng to listen for incoming log messages using the UDP protocol on port 514. The received logs are written to the local logs folder based on a templated $HOST-$PROGRAM.log file format.
@version: 3.11options {
keep_hostname(yes);
create_dirs(yes);
ts_format(iso);
time_reopen (10);
};
source s_net {
udp(
ip("0.0.0.0")
);
syslog(
ip("0.0.0.0")
);
};
destination d_files {
file("/var/log/syslog-ng/$HOST.log");
};
log {
source(s_net);
destination(d_files);
};
With our containers and syslog-ng server configuration files defined, we can spin up all of our containers with the following command:
$ docker-compose up
Once the containers have started, the local logs folder begins to populate with log files from our two Apache web servers. When we access localhost:8080 and localhost:8090, we notice new log entries generated to each host for the requests.
Take note of the two Apache web servers that are starting and receiving requests in the consolidated log file sample below.
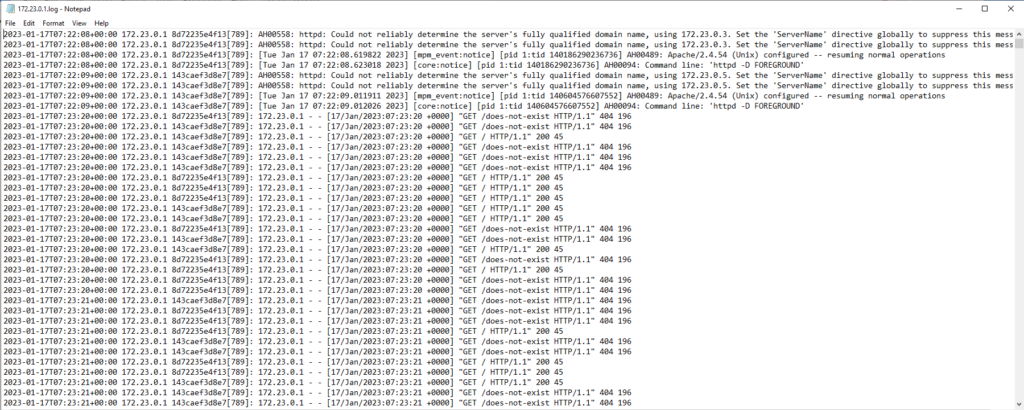
With this simple example, we’ve consolidated the log files from two different Apache web servers into a single logs folder managed by a master syslog-ng server. No modification is required on the master server for any new application or web server instances. New logs can be forwarded to the existing logging server to begin the ingestion of new data.
Centralizing Log Data with Falcon LogScale
As seen in the previous example, creating a consolidated logging layer easily allows you to collect and manage the logs of many Apache web server instances. To further simplify this setup, you can use a remote logging backend, like Falcon LogScale, which allows you to administer and access all your log data and features centrally.
Vector logging client
With a centralized logging solution like Falcon LogScale, you can mix and match the logging clients you use to send data to the service, choosing whatever works best for your application, team, or organization. For example, the Vector logging utility, which can support many different log sources and destinations, is an alternative to the syslog clients that we used in our example.
Vector runs next to your Apache web server process. It can forward any newly found log file contents to a platform as configured in a simple configuration file. Vector integrates directly with LogScale. Below is an example configuration:
[sources.file_source]type = "file"
ignore_older_secs = 600
include = [ "/etc/logs/**/*.log" ]
read_from = "beginning"
encoding.charset = "utf8"
[sinks.logscale_cloud]
type = "humio_logs"
inputs = [ "file_source" ]
host = "https://cloud.community.humio.com"
token = "${LOGSCALE_REPOSITORY_INGEST_TOKEN}"
encoding.codec = "text"
Vector has an extensive list of log sources available, making it simple to send your logs to Vector for reading, which can subsequently be shipped to one of many available log sinks, including LogScale.
Querying log data
With the configuration provided above, Vector reads the log files on a host and ships them to Falcon LogScale. This will let us get more out of our log data. Falcon LogScale provides the ability to quickly query the logs collected across all web server instances, so long as you ship all of their logs to Falcon LogScale. The query language from Falcon LogScale allows for the building of complex queries to help you with in-depth analysis.
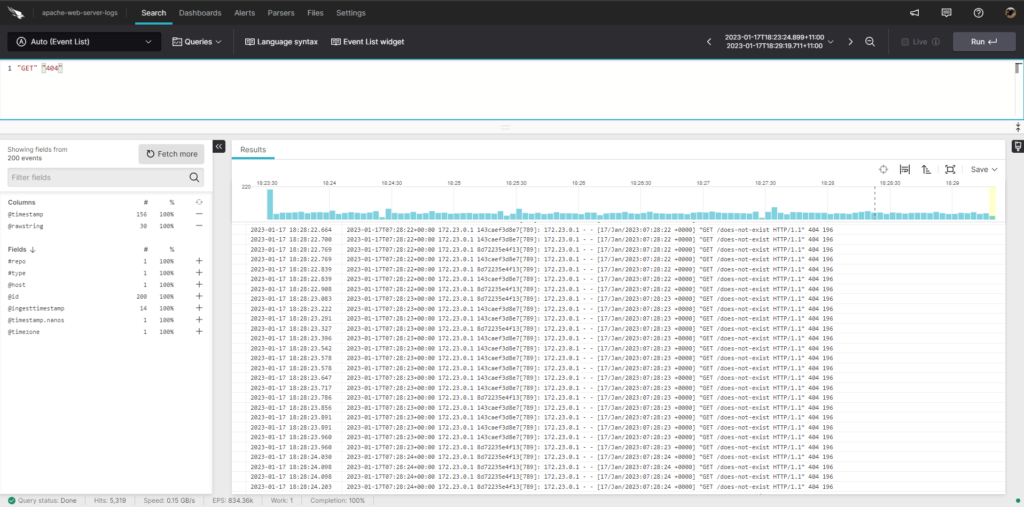
With these querying capabilities, you can quickly source the relevant log data needed to track down issues or better understand how your Apache web server is running.
For example, the query below searches the Apache web server access logs for requests made only by the host c65e6b979165, filtering to only GET requests made and to the path /does-not-exist.
!"c65e6b979165" | //ignore request made to this host id"GET" | // only look at get requests
"/does-not-exist" // only look at this request path
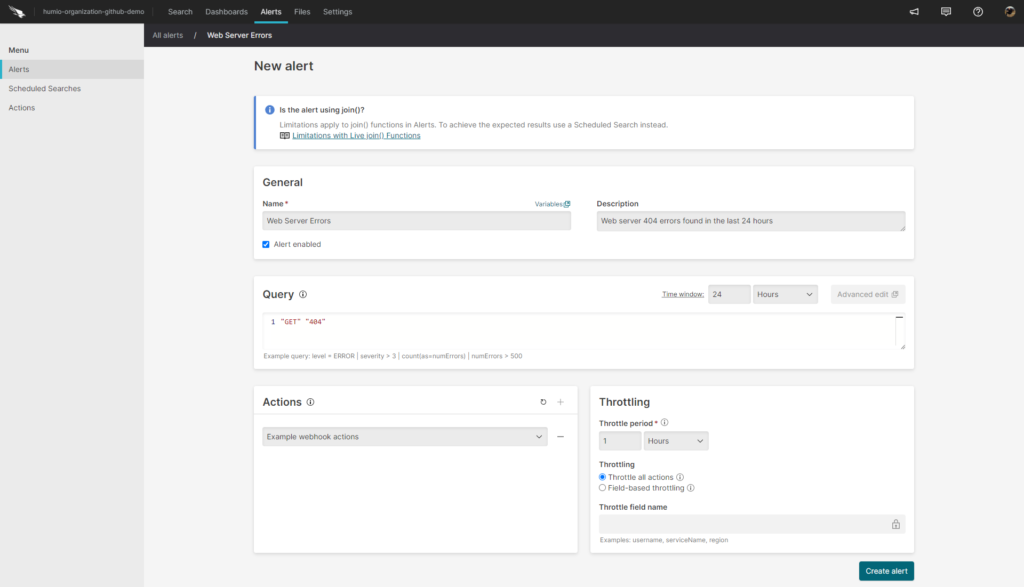
Alerting on Log Data
To take it further, we can link the results of our queries with Falcon LogScale’s alerting capabilities. This way, we can trigger automated actions when a query returns a predefined value within a specific window of time. This simple action allows developers to respond quickly to incidents as they happen.
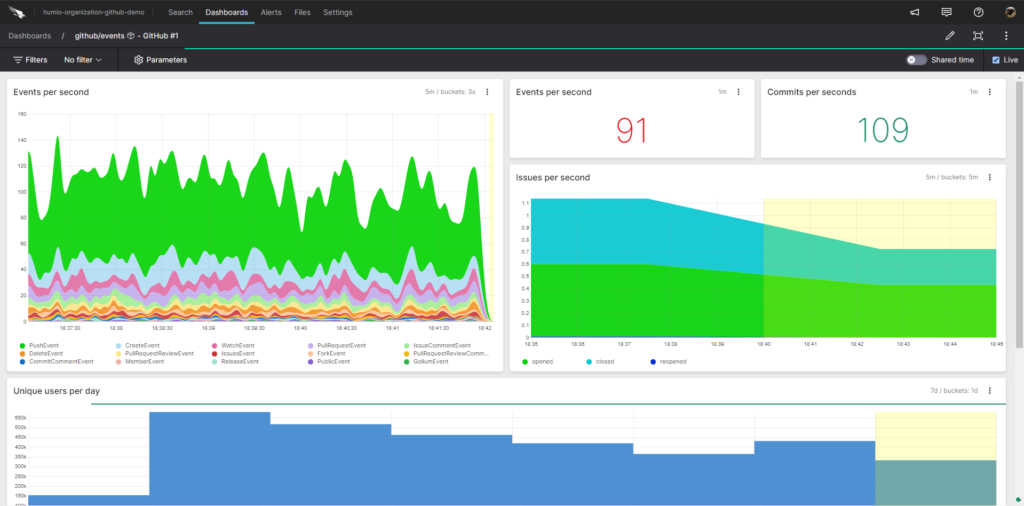
Dashboarding Log Data
Viewing log data is not just restricted to its text form. In most cases, a more efficient way to process the information is to visualize the logging data at a glance. Falcon LogScale’s dashboards allow you to visualize simple queries as new data enters Falcon LogScale. Below is an example of possible visualizations in the Falcon LogScale platform, including example data from a GitHub repository.
Log your data with CrowdStrike Falcon Next-Gen SIEM
Elevate your cybersecurity with the CrowdStrike Falcon® platform, the premier AI-native platform for SIEM and log management. Experience security logging at a petabyte scale, choosing between cloud-native or self-hosted deployment options. Log your data with a powerful, index-free architecture, without bottlenecks, allowing threat hunting with over 1 PB of data ingestion per day. Ensure real-time search capabilities to outpace adversaries, achieving sub-second latency for complex queries. Benefit from 360-degree visibility, consolidating data to break down silos and enabling security, IT, and DevOps teams to hunt threats, monitor performance, and ensure compliance seamlessly across 3 billion events in less than 1 second.
Arfan Sharif is a product marketing lead for the Observability portfolio at CrowdStrike. He has over 15 years experience driving Log Management, ITOps, Observability, Security and CX solutions for companies such as Splunk, Genesys and Quest Software. Arfan graduated in Computer Science at Bucks and Chilterns University and has a career spanning across Product Marketing and Sales Engineering.