Syslog is a popular message logging standard that was developed as part of the SendMail project in the 1980s. It provides a protocol for devices and applications to record and send data.
Syslog has become a popular and crucial component in network, infrastructure, and application monitoring. It facilitates the centralization and management of large log volumes and is often used in conjunction with log management software to provide analytics capabilities.
This article is part one of a multi-part series covering logging concepts with syslog. In part one, we’ll cover what syslog is, how it works, and the notable components of its architecture. We’ll also provide an overview of the two most common syslog message formats, along with the pros and cons of using syslog.
Learn More
- Part 1: The Basics
- Part 2: Advanced Concepts
- Part 3: Working with Syslog-ng
- Part 4: Using a Centralized Log Management Solution
What is Syslog?
Syslog is a standardized message logging protocol supported by numerous operating systems, applications, and hardware devices for transmitting data. It was formalized into RFC 3164, and as RFC 5424 in 2009.
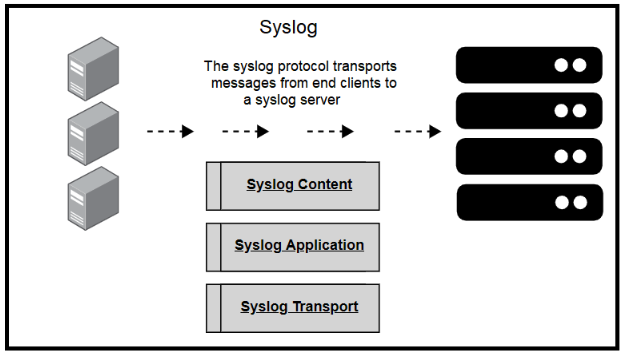
A source system will log the message locally, then immediately send it to a pre-configured syslog server. Syslog allows the use of a number of transport protocols for transmitting syslog messages. In most cases, a syslog server will receive logs from several source machines.
Syslog messages include standard attributes, such as:
- Timestamp
- Hostname
- Severity level
- Source IP
- … and more.
They can also include event messages specific to the system creating it. You can use syslog messages for various use cases, such as security investigations, auditing, system management, and infrastructure maintenance.
How Syslog Works
Syslog uses a client-server architecture, where a client generates logs and sends them over the network to a dedicated syslog server that listens for the logs. The syslog server listens on a specific port and logs the messages based on the rules configured in the /etc/syslog.conf file.
The default port used by the server is UDP 514. However, in recent syslog implementations such as rsyslog or syslog-ng, you can modify this to TCP. Some users choose UDP because it is faster, and some data loss is acceptable for them. Others use TCP when they can’t afford any data loss and can accept slower speeds. In some cases, you might configure the device or application to send messages to multiple syslog servers for redundancy.
The syslog standard defines three layers:
- Syslog Content: The data contained within the syslog message (the standard defines the format to present this in)
- Syslog Application: The application that deals with message generation, routing, interpretation, and storage
- Syslog Transport: How syslog messages transmit from client to server in a network
Components of a Syslog Server
A syslog server is a physical machine or virtual machine (VM) dedicated to receiving, storing, and organizing logs from a number of sending devices. Every syslog server is made up of several components:
- Syslog Listener: Listens for and collects messages sent over the network
- Syslog Database: Stores and organizes log messages sent from one or multiple devices, applications, or servers
- Management and Filtering Software: Provides an efficient way to store, filter, and search through a large volume of log data. Users should be able to filter by specific terms—such as hostname, username, or severity—to narrow their search. Buffering is possible for dropping irrelevant messages or redirecting them elsewhere to save disk space.
Syslog Message Format
Two standards dictate the rules and formatting of syslog messages. These standards help ensure that all systems using syslog can understand one another.
BSD-syslog Format (RFC 3164)
BSD-syslog format is the older syslog format and contains a calculated priority value (known as the PRI), a header, and an event message. PRI is calculated using the facility and severity level.
The facility value determines which machine process created the event.
| Facility Number | Facility Description | Facility Number | Facility Description |
|---|---|---|---|
| 0 | kernel messages | 12 | NTP subsystem |
| 1 | user-level messages | 13 | log audit |
| 2 | mail system | 14 | log alert |
| 3 | system daemons | 15 | clock daemon |
| 4 | security/authorization messages | 16 | local use 0 (local0) |
| 5 | messages generated internally by syslog | 17 | local use 1 (local1) |
| 6 | line printer subsystem | 18 | local use 2 (local2) |
| 7 | network news subsystem | 19 | local use 3 (local3) |
| 8 | UUCP subsystem | 20 | local use 4 (local4) |
| 9 | clock daemon | 21 | local use 5 (local5) |
| 10 | security/authorization messages | 22 | local use 6 (local6) |
| 11 | FTP daemon | 23 | local use 7 (local7) |
The severity level identifies the criticality level of the event and is useful for filtering events and determining alert action.
| Severity Level | Severity Description |
|---|---|
| 0 | EMERGENCY - System unusable |
| 1 | ALERT - Action must be taken immediately |
| 2 | CRITICAL - Critical conditions |
| 3 | ERROR - Error conditions |
| 4 | WARNING - Warning conditions |
| 5 | NOTICE - Normal but significant conditions |
| 6 | INFORMATIONAL - Informational messages |
| 7 | DEBUG - Debug level messages |
The PRI is calculated as follows, with a lower PRI indicating higher priority:
(Facility Value * 8) + Severity Value = PRI
The header includes the timestamp and the hostname or IP address of the sending client. The event message shows the name of the application or process that generated the message and a description of the event.
<34>Oct 09 15:00:00 machine1234 su: 'su root' failed for jbloggs on /dev/pts/8
IETF-syslog Format (RFC 5424)
The IETF-syslog format is the newer syslog format that uses UTF-8 encoding and includes a header, structured data, and the event message.
The header is made up of the following parts:
- PRI
- Version
- Timestamp
- Hostname
- Application
- PID
- Message ID
The structured data section includes key-value pairs of metadata regarding the syslog message. The message itself contains information about the event, performance, or diagnostics depending on the event and the device or application generating it.
<34>1 2022-10-09T15:00:00.000Z machine1234.domain.com su - - - 'su root' failed for jbloggs on /dev/pts/8
Advantages and Disadvantages of Using Syslog
It’s important to weigh the pros and cons when deciding whether to use syslog.
Any environment requires centralized logging to store logs, improve resilience, and provide additional redundancy. This is especially true for more complex environments. One advantage of syslog servers is that they facilitate central analytics for improving performance, spotting trends, and investigating incidents.
The syslog message format is standardized across all devices and applications, making it easier to parse and understand the incoming logs. Most central logging tools have built-in parsers for both syslog formats, so you can spend less time parsing and more time analyzing the data.
However, as with any solution, there are also some drawbacks you should consider before implementing syslog in your application architecture.
Syslog messages are sent in clear text, and there is no requirement to encrypt data on message transport. This means that there’s a possibility that attackers could intercept and read messages. Using a VPN would help mitigate this risk as long as the attacker is not already within the network.
Syslog does not have an authentication feature. On receipt of a log message, the syslog server doesn’t verify the hostname or source IP address of the sending client. As a result, it’s possible for logs to be spoofed by tools such as netcat. For this reason, syslog is vulnerable to denial-of-service attacks, in which the network is flooded by invalid syslog messages.
Relying on UDP can lead to a high level of packet loss, particularly in high-latency environments. This can cause a big issue for time-sensitive or security logs where people rely on the data for their processes.
Log your data with CrowdStrike Falcon Next-Gen SIEM
Elevate your cybersecurity with the CrowdStrike Falcon® platform, the premier AI-native platform for SIEM and log management. Experience security logging at a petabyte scale, choosing between cloud-native or self-hosted deployment options. Log your data with a powerful, index-free architecture, without bottlenecks, allowing threat hunting with over 1 PB of data ingestion per day. Ensure real-time search capabilities to outpace adversaries, achieving sub-second latency for complex queries. Benefit from 360-degree visibility, consolidating data to break down silos and enabling security, IT, and DevOps teams to hunt threats, monitor performance, and ensure compliance seamlessly across 3 billion events in less than 1 second.
Arfan Sharif is a product marketing lead for the Observability portfolio at CrowdStrike. He has over 15 years experience driving Log Management, ITOps, Observability, Security and CX solutions for companies such as Splunk, Genesys and Quest Software. Arfan graduated in Computer Science at Bucks and Chilterns University and has a career spanning across Product Marketing and Sales Engineering.