


![Helping Non-Security Stakeholders Understand ATT&CK in 10 Minutes or Less [VIDEO]](https://assets.crowdstrike.com/is/image/crowdstrikeinc/video-ATTCK2-1?wid=530&hei=349&fmt=png-alpha&qlt=95,0&resMode=sharp2&op_usm=3.0,0.3,2,0)
![Qatar’s Commercial Bank Chooses CrowdStrike Falcon®: A Partnership Based on Trust [VIDEO]](https://assets.crowdstrike.com/is/image/crowdstrikeinc/Edward-Gonam-Qatar-Blog2-1?wid=530&hei=349&fmt=png-alpha&qlt=95,0&resMode=sharp2&op_usm=3.0,0.3,2,0)


?wid=2048&hei=1350&fmt=png-alpha&qlt=95,0&resMode=sharp2&op_usm=3.0,0.3,2,0)


Interest in machine learning is on the rise. This was evidenced by the attendance of our recent CrowdCast on the topic — if you haven’t seen it yet, head over to our CrowdCast Channel and take a quick look.
Recap
One of the main takeaways of the CrowdCast is that machine learning allows you to combine a number of weak indicators to get a stronger indicator that can be used to make a confident decision. Let’s take a look at a quick example. I’m using the 1988 Anthropometric Survey of Army Personnel. The data is more intuitive and less noisy than what we’d find in the security space, so it’s well suited to illustrate a few points. The problem at hand is that we’re trying to predict gender based on measurements from the Army survey. Let’s take a look at a first measurement, in this case the weight. In the chart below, the x-axis shows the weight, which the Army study reports in tenths of a kilogram, about 0.22 lbs. The y-axis shows the density (how many soldiers fall into the respective weight range). At the bottom, you can also see a rug plot with one tick corresponding to every soldier measured, red for female soldiers and blue for male ones. 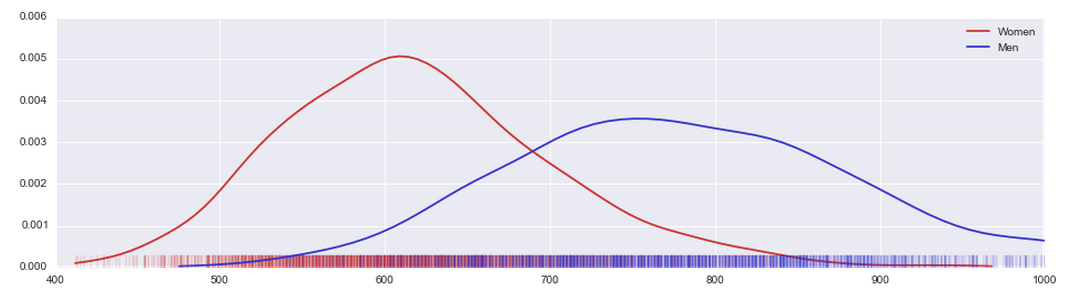 As we can see, there’s a lot of overlap between the two classes used in the study, male and female. For a large range of weights, the curves overlap, and we also see mixed red and blue ticks corresponding to the individual measurements. Let’s pick another measurement, in this case the “buttock circumference,” which the Army study reports in millimeters.
 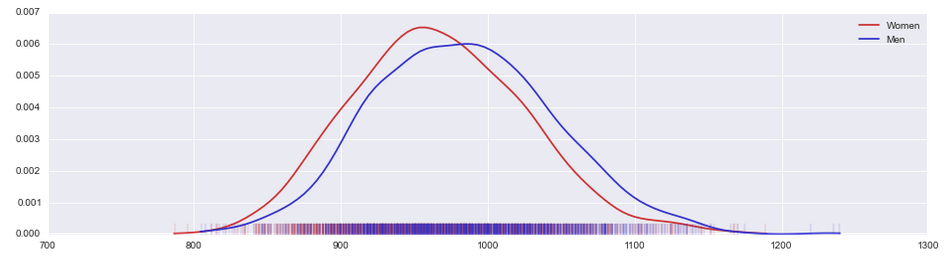 Same here. In fact, the overlap is even worse. Neither of these two measurements allows us to reliably predict the gender from the measured value. So what happens if we look at both at the same time? Here’s how that looks with the weight on the x-axis and the buttock circumference on the y-axis. Every circle corresponds to the two measurements for one soldier. The two prior charts are overlaid on each axis.
 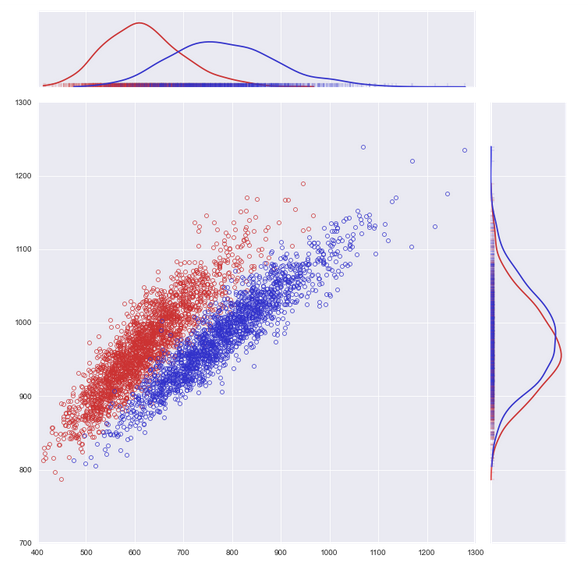 As you can see, there’s a lot less overlap now that we look at both measurements at the same time even though each individual measurement has a lot of overlap. If you take your own measurements, chances are fairly good that you’ll land right in the cluster corresponding to your gender. Instead of doing this in two dimensions, in machine learning we do this in up to millions of dimensions. (Watch the video to put that number into a better perspective.)
The Right Recipe
In the security space, we can similarly get great detection results by combining many weak indicators. Such indicators are derived from properties or behaviors, e.g. of files or processes, and we then use machine learning to make predictions. So is that “math” that makes that work? Not exactly. Math is table stakes. It doesn’t inherently make a product any better the same way that a sports car isn’t faster because it uses “physics.” What matters is the clever combination of parts into something bigger. CrowdStrike CEO George Kurtz has laid out an important cornerstone on how to do such a combination: Never fail silently. As an industry, we learned the hard way that we must not rely on perimeter defense only. In perimeter defense, a network is encircled by metaphorical city walls. Once an adversary breached these walls, he or she can move freely. But yet, many current solutions are engaging in what can only be described as temporal perimeter defense. This temporal perimeter encircles the first few seconds of execution. Once a targeted threat survives these first few seconds, chances are good that it will go undetected for years (or worse, forever). Therefore, it is critical to look both at any place and any time frame. To address these technical challenges, CrowdStrike Falcon® uses a unique architecture comprising a lightweight (just a couple of MBs in size) kernel-mode sensor running on endpoints (servers, desktops, laptops, tablets, etc.) and a scalable Big Data cloud. Detection can occur locally to the sensor, e.g. for behaviors such as attempted theft of login credentials by an adversary trying to move laterally through the victim network. Moreover, detection can occur jointly between sensor and cloud, e.g. in cases where large scale cloud data or heavy computing is part of a detection. Lastly, detection can occur exclusively in the cloud, e.g. when analyzing long timeframes across hundreds of thousands of sensors at a time.
Blocking Attacks
How can machine learning help? Naturally, it is used to do better in those first few seconds, but it cannot change the realities: there is not much information to work with, and an adversary has months worth of time to craft stealthy attack tools. Nonetheless, there is data available that should be utilized. Files can be analyzed on the host or in the cloud. The latter has the advantage of posing no performance impact to the host but requires a sample to be available in the cloud. To weed out as much noise as possible with little endpoint impact, we analyze all incoming files in the cloud. When an endpoint reports the attempted execution of such a file to the cloud, we can now take action. For PE files as an example, there are many static and structural properties that can be evaluated such as size, composition based on sections, entropies, list of imported library functions, list of strings, or types of strings (IPs, URLs, file paths, registry keys, verbs from certain network protocols, etc.). Furthermore, data can be augmented with non-static meta data such as proliferation (how many nodes or networks saw the file), known locations on the file system, or pedigree (Web download, email attachment, USB drive, network share, etc.). In contrast to the data in the Army survey, there are no two features that are a slam dunk, but instead we need to add feature over feature to increase the separation in our instance space. For example, for a large subset of high-impact malware, we expect networking capabilities. The presence of these can be deduced based on imported functions or e.g. IP strings in the file. Furthermore, we expect some type of mechanism ensuring persistence. Imports related to registry manipulation or strings of registry keys are of use to deduce this capability. Moreover, utilization of GUI methods is less common in some malware (but would be common for e.g. adware). Slowly but surely we can zero in on a separating boundary. Below is an example of how this looks if we do this for a large number of features with malware samples plotted in black and clean files plotted in green. 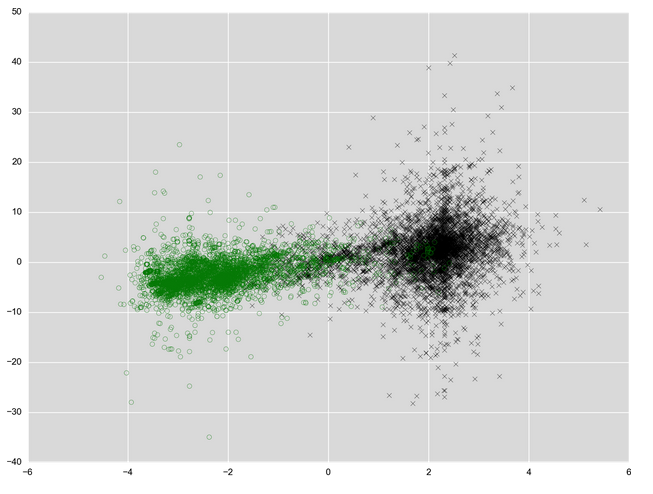 We can see decent separation of the data, but there are nonetheless a number of stray clean files in the malware cluster, which have the potential to become false positives when classifying overly aggressive.
Exploitation and Behavior
Next, once an executable runs, we can monitor its execution profiling behavior. This does not have to be a malware executable, it can as well be a dual-use tool or an exploited legitimate application. Furthermore, the behavior is not constrained to the process itself; we can also monitor its children or other processes it significantly impacted (e.g. by starting a service). A non-trivial aspect of getting to this data is how to collect it efficiently without impacting endpoint performance significantly (and without being overly chatty on the network). The Falcon sensor fortunately solves this problem and in fact also allows searching through the collected data using the Endpoint Activity Monitoring application. Just starting with the works already surfaces a number of interesting properties. Let’s take a look, for example, at network event data generated by a system. From these events, we can derive the distribution of ports connected to, ratio of internal to external IPs, unique IPs connected to, and unique domains resolved. A simple first problem to solve is to determine how a browser looks different from malware contacting its command and control server (and for simplicity’s sake, let’s assume the browser does not use a proxy). A browser will generally resolve a large number of unique domains and contact a large set of IPs. There are also temporal cues, e.g. a small burst of activity while the user fetches a new page followed by idle time while the user reads. The malware will contact a small number of IPs with little activity in regular intervals. There are of course other legitimate applications that look similar to the example malware behavior outlined above, consider for example a text editor with an online update feature. For that reason, we look at many more such characteristics at the same time.
Containment
Finally, never stop looking. In the case of CrowdStrike Falcon®, the Falcon cloud aggregates large scale telemetry data, which can be analyzed at the time scales necessary to spot an entrenched adversary. This is a hard problem. It takes domain expertise to express the metrics, measurements, and characteristics that are relevant to evaluate, and Machine Learning is the tool that allows evaluation at non-trivial data sizes. At CrowdStrike, we leverage the experience and skills of our Falcon Overwatch team to do just that.
Summary
Whenever there is a large number of weak indicators and a classification or prediction problem, machine learning is a great tool to consider. However, it is not just the classification algorithm itself that makes the difference. To a large extent, we need to first look in the right places and extract the right data — the data that has both predictive power and can also be extracted without a prohibitive performance impact.