


![Helping Non-Security Stakeholders Understand ATT&CK in 10 Minutes or Less [VIDEO]](https://assets.crowdstrike.com/is/image/crowdstrikeinc/video-ATTCK2-1?wid=530&hei=349&fmt=png-alpha&qlt=95,0&resMode=sharp2&op_usm=3.0,0.3,2,0)
![Qatar’s Commercial Bank Chooses CrowdStrike Falcon®: A Partnership Based on Trust [VIDEO]](https://assets.crowdstrike.com/is/image/crowdstrikeinc/Edward-Gonam-Qatar-Blog2-1?wid=530&hei=349&fmt=png-alpha&qlt=95,0&resMode=sharp2&op_usm=3.0,0.3,2,0)


?wid=2048&hei=1350&fmt=png-alpha&qlt=95,0&resMode=sharp2&op_usm=3.0,0.3,2,0)


- Threat actors go to great lengths to hide the intentions of the malware they produce
- This blog demonstrates reliable methods for extracting information from popular Linux shells
- Extracted memory information can help categorize unknown software as malicious or benign and could reveal information to help incident responders
- Some malware is only ever resident in memory, so memory scanning along with behavioral analysis could be the only viable approach to detection and mitigation
Typically, ransomware does not have the encryption keys embedded in the software, as this would allow researchers to easily decrypt the encrypted files. This would also mean that the same key is being used across multiple victims. Instead, ransomware actors generate a public key and a private key when on target. These actors then encrypt the private key using the public key, and there is a small window where the private key is unencrypted and in memory. But, the inputs used to generate the private key could remain in memory, unencrypted. If security researchers can gather this information, it would allow the recreation of the public and private keys to help the victim recover without paying the ransom. Additionally, fileless malware is becoming increasingly common, and in these cases, behavioral detections and memory scanning may be the only means of detection and mitigation. With fileless malware, important information can be stored in environment or local variables. This technique obscures what is actually happening, even when security researchers recover command history. What’s stored in the shell’s memory could be anything from encryption keys to
bash commands.
Threat actors employ memory-scanning techniques to accomplish tasks such as password stealing. They know that memory scanning is difficult and requires an upfront investment in reverse engineering, and therefore hiding certain information in the memory of a process could be enough to thwart detection. Once the shell is closed, the memory will be cleaned up by the operating system, making reconstruction of that memory almost impossible.
Practical Use Cases
When a malicious program is running, there will be artifacts in memory. Theoretically, by halting the ransomware and dumping the memory, incident responders and security researchers could obtain the malware’s secrets to help them piece together what happened. Or, perhaps an indicator of attack could be present in memory but not readily apparent in the binary. Another use case is analyzing packed or encrypted running programs. Even if the entire program is not unpacked at once, certain sections or segments must be unpacked for the program to run. Some of this information can be used as an indicator of malware. Inspecting the process’s memory is the only way to obtain this information at run time. The following script is from DarkRadiation ransomware, which is an example of “living off the land” malware. DarkRadiation script snippet
- PASS_DE is visible in memory and in network traffic
- PASS_ENC is visible in memory and in the command line used to launch the script
- PASS_DEC is visible in memory only
Proof of Concept Using Linux
Whether an attacker is trying to read another process’s memory, or if defenders are reading process memory to defend against attackers, the techniques are similar. For our purposes, we inspected the memory of Linux shells such asbash. This is useful as a proof of concept because it demonstrates reliable methods for extracting information.
Methodology
The methodology at a high level is to parse the target process’s memory and associatedelf file. This is accomplished by reading the files:
/proc/<pid>/maps/proc/<pid>/mem
/proc represent a pseudo-filesystem. These files are not real, but instead contain runtime system information. For more information, see man proc.
Under the /proc/<pid>/ directory, the maps file shows the full path of the running program and where the process is mapped in memory. The mem file contains the memory of the running process to include the sections:
- text
- data
- bss
- heap
- loaded shared objects
elf files. The vast majority are not particularly interesting from a malware perspective, but a few can be very interesting.
- .text: machine instructions for the CPU
- .data: initialized global variables
- .rodata: initialized read-only global variables (such as strings)
- .bss: uninitialized global variables
- .symtab: global symbol table
- .dynsym: symbol tables dedicated to dynamically linked symbols (runtime dependency linking)
- .strtab: string table of .symtab section
- .dynstr: string table of .dynsym section
elf file without affecting execution, other sections cannot be removed.
Memory Scanning
The “trick” to memory scanning is to find the data of interest in memory. Different shells store history in different ways.Bash uses a table, tcsh uses a doubly linked list, and zsh also uses a doubly linked list, implemented in a ring. All shells examined are stripped of symbols but have imports and exports that can be used to navigate to the data structure we are looking for.
Bash
Bash exports the symbol “history_list”. This function only has one line, returning a pointer to the data structure that contains the history.
Parsing the elf file, we obtain the “.dynsym” and “.dynstr” sections. This is enough to get the address offset of the “history_list” function.
Also, the symbol “history_length” is exported. This is important because it lets us know how far to go when iterating through the table.
To obtain the actual length, we use the “history_length” symbol. We then read the address that the symbol points to.
To obtain the address of the history table, we have to go to the text section to read the spot that “history_list” returns. Then we have to parse the x86_64 instruction. This will give us the address of the table.
Once we have these two values, we simply iterate through the table.
Tcsh
It is a little more complicated to find the data structure intcsh than in bash or zsh because there are no symbols we can use as reference points. Therefore, we have to go through the text section more extensively. The elf header points to the entry point, which is “start”. We can find “main” from there, as its address is the first parameter passed into “libc_start_main”. Once in main, a wide character string “history” is passed into another function that keeps track of the history length. The function call just after that is a call to “sethistory”. This function gives us the length of the history and another function call, “discardExcess”. A pointer to the data structure that contains the history’s linked list is checked for NULL right at the beginning of this function.
At this point, we have everything we need to parse the linked list and obtain the history.
Zsh
Zsh is a bit easier because the binary exports the data structure we need. We get the offset address of the pointer by parsing the elf file, and the value of the pointer by reading from that spot in memory.
We now have what we need to walk the link list implemented in a ring. This means we can walk the list forward or backward from this pointer. If we intend to walk the entire list instead of just grabbing the most recent entry, we have to keep track of where we started, or we will go around the ring forever.
A Detailed Walkthrough
We need thepid of the process we want to examine. For our purposes, in the target shell, we can type echo $$. This prints the pid of the shell to the screen. If this were not possible for some reason, the ps command prints information on every process on a system when certain parameters are used. See man ps for more information.
Once the pid is obtained, we start examining the target process. Our program must be run as root. This is necessary to read another process's memory. There are two files under the /proc/<pid> directory that this program uses. As an example, say the process’s pid is 3930. In this case, the files /proc/3930/maps and /proc/3930/mem are both opened for reading. If we also want to change the process’s memory, the /proc/3930/mem file could be opened in read/write mode.
We first read the maps file. To better understand this file and get more information, see the man page for proc.
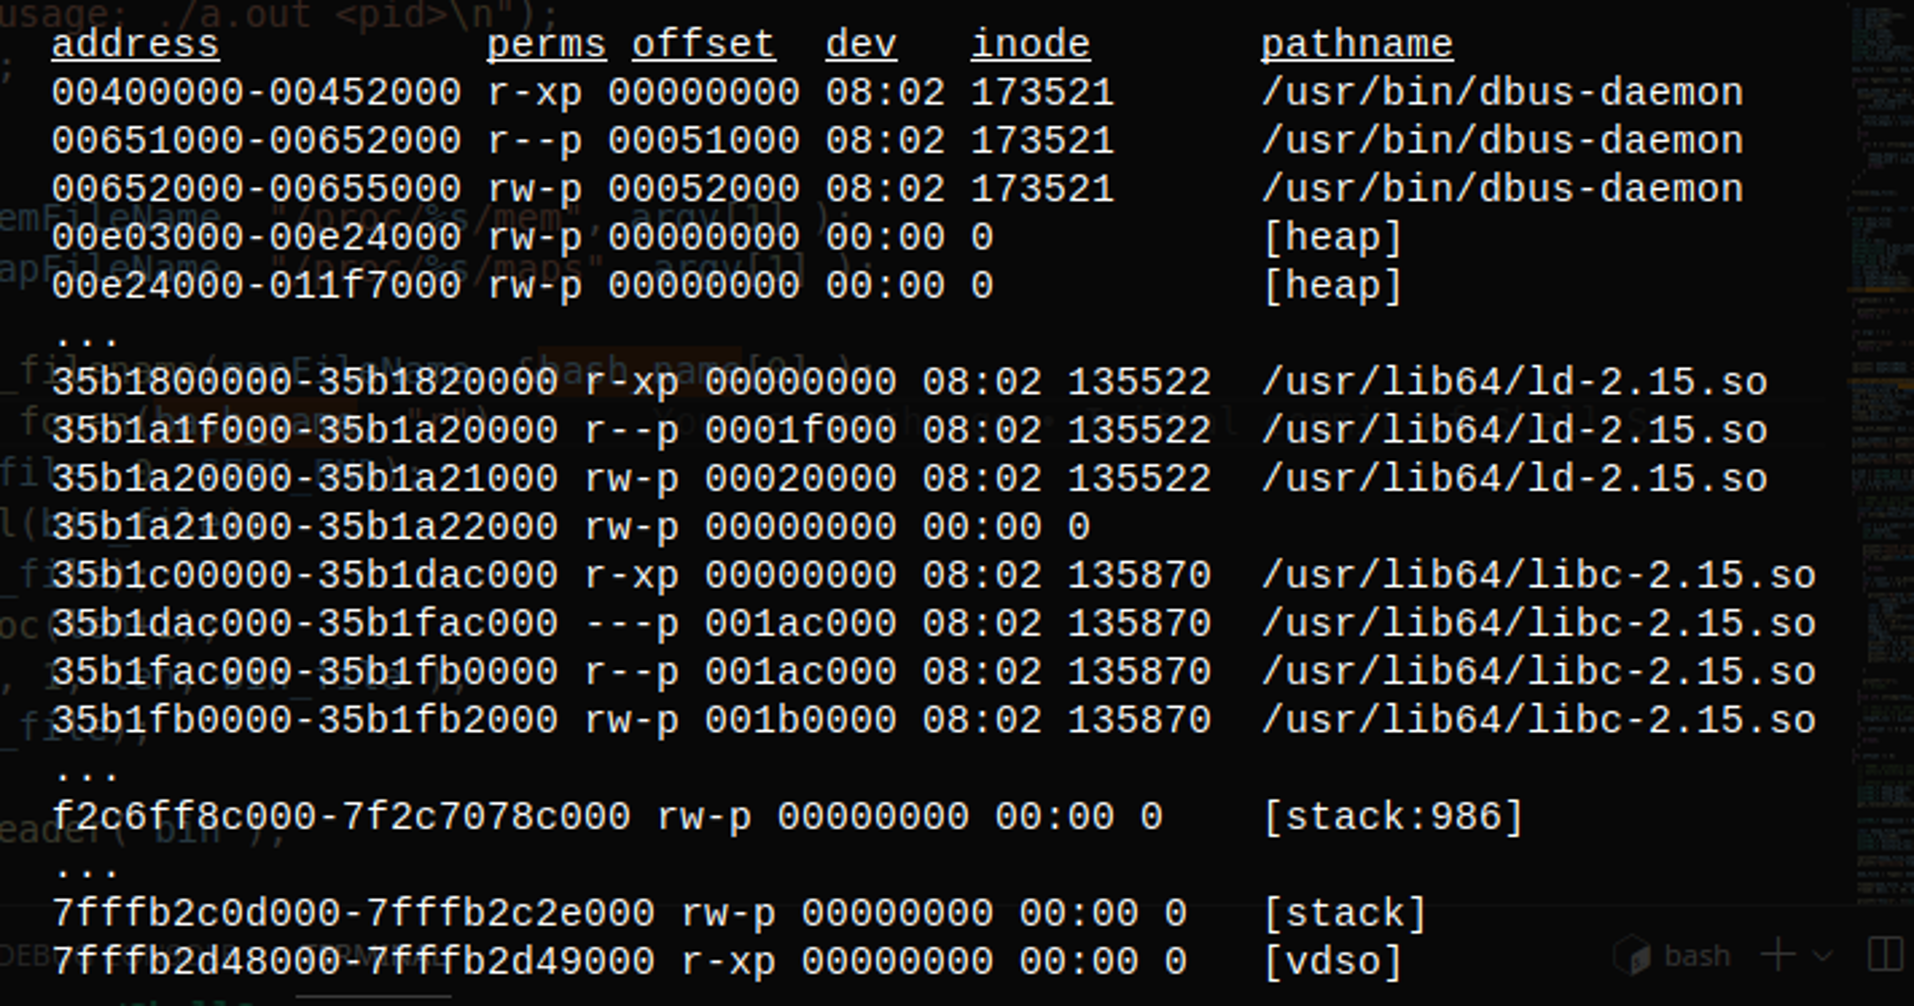 Sample
 maps file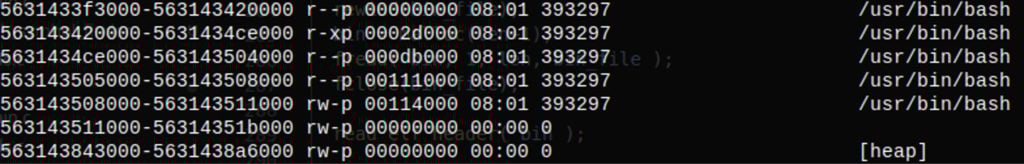
maps file for bash
Acquiring the Data Structures
Using the full path to theelf file, we open the binary file and parse the headers. We obtain the addresses of the various sections of the elf file by reading the elf header, and then iterate the section headers. To make subsequent reading easier, we also copy the section headers into a global array of structures.
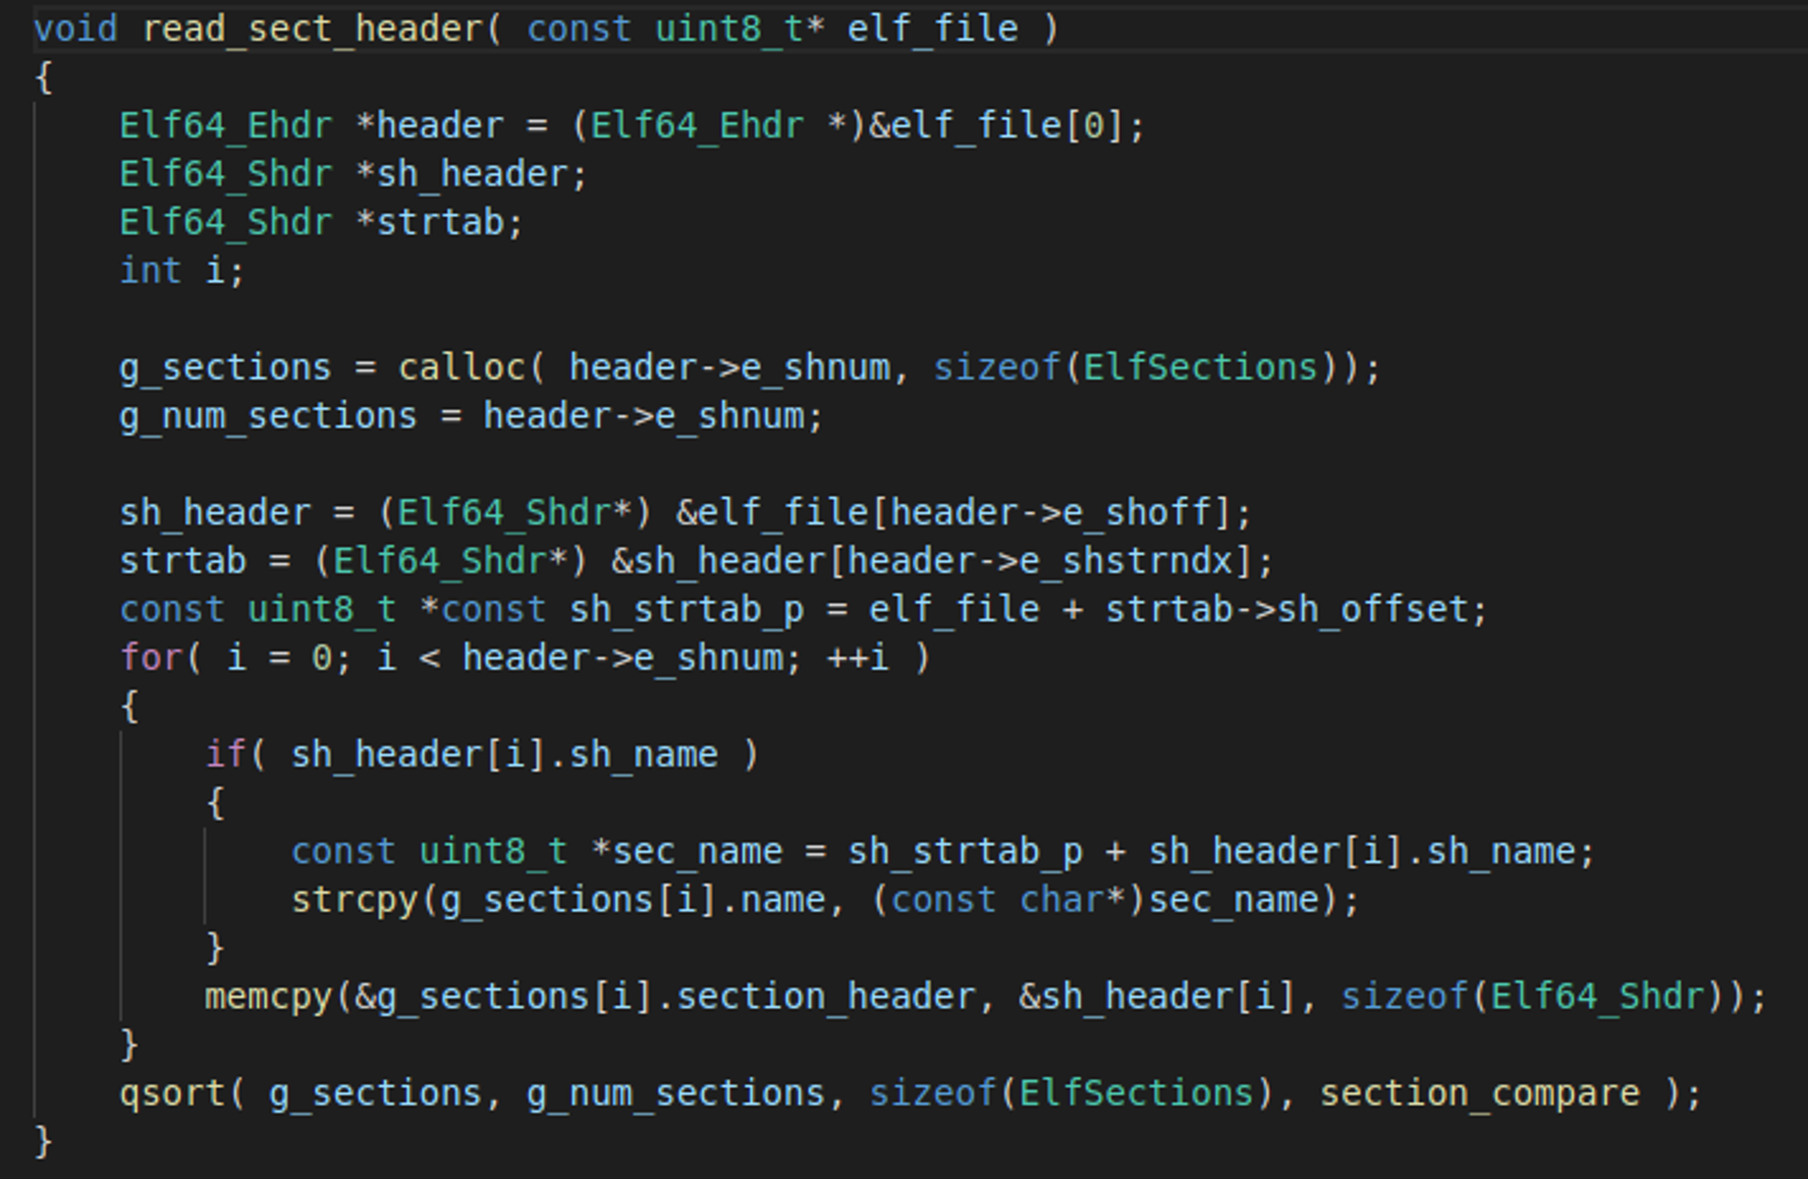 Parsing section headers
bash and zsh, we are interested in the .dynsym and .dynstr sections. The examination of the tcsh shell requires the .text and .data sections.In the case of
bash and zsh, simply iterate through the .dynsym section and call strncmp to find the strings/symbols that we need.
We use the capstone library to parse instructions in the tcsh shell. We know that the address of main is the first argument passed into libc_start_main. We therefore know that very near the entry point there will be an instruction similar to this:
"rdi, qword ptr "
This instruction tells us to load the value found relative to the value of the RIP register into the RDI register. This value is the address of the main function.
Continuing to use capstone, we start iterating through main, this time looking for a reference to the wide character string “history”. We know that this string along with a hard-coded value of 100 are passed into the sethistory function. The address of the string is moved into the register using the lea mnemonic, while 0x64 (which is 100) is moved into EDI using the mov mnemonic. When we see these instructions followed by a call instruction, we have a high degree of confidence that we have found the correct instruction.
Next we start examining the instructions in the sethistory function. Once here, the first instruction moves the histlen global variable into the EDI register. The second instruction is a jump into the function discardExcess. This is a jump instead of a call because the compiler optimizations implemented this function inline. Once in discardExcess, there are two move commands to load the addresses of histTail and histCount into registers. Once we have these addresses, we are ready to simply iterate through the linked list, which gives us the history.
Parsing the Data Structures
Bash places the command line history in an array. Therefore, once we have the address of the table, we simply iterate through the table the number of times indicated by the length global variable.
Zsh and tcsh both store the history in a link list, with the notable difference being that zsh uses a circular doubly linked list. Therefore, when walking through the linked list in zsh, you could go around the ring forever. This implementation means that it is easy to walk the list both forward and backward. We simply have to keep track of the starting point, and when we see that address again, we know that we have gone all the way around. With tcsh, we simply follow the linked list until the next pointer points to NULL. With tcsh, we captured the address of the list’s length in our initial parsing, so alternately, we can just iterate through the list the number of times indicated by this global variable.
Command Line Value
An example from DarkRadiation: In this case, the password is being changed for all users except root. The standard input and standard output of four different commands are piped together in one command line. If these commands are inspected individually, it would be difficult to piece together what is actually happening here. By going into the shell to obtain the history, we can see the entire command line and more easily reconstruct the attack.
Bottom Line
Scanning process memory is a powerful tool that both adversaries and security researchers use. Threat actors can use memory during various stages of an attack lifecycle — reconnaissance, persistence, defense evasion, credential access and discovery — to achieve their goals. However, security researchers can use extracted memory information to reveal whether unknown software is malicious or benign, especially when popular Linux shells are abused. Whether it's threats or sophisticated adversaries, CrowdStrike remains dedicated to our main mission: stopping breaches.Additional Resources
- Learn more about how the Falcon platform protects Linux systems in this solution brief.
- Read this press release for information about CrowdStrike Falcon®’s enhanced Linux protection: CrowdStrike Falcon® Expands Linux Protection with Enhanced Prevention Capabilities
- Visit the product website to learn how the powerful CrowdStrike Falcon® platform provides comprehensive protection across your organization, workers, data and identities.
- Get a full-featured free trial of CrowdStrike Falcon® Prevent™ and learn how true next-gen AV performs against today’s most sophisticated threats.


