


![Helping Non-Security Stakeholders Understand ATT&CK in 10 Minutes or Less [VIDEO]](https://assets.crowdstrike.com/is/image/crowdstrikeinc/video-ATTCK2-1?wid=530&hei=349&fmt=png-alpha&qlt=95,0&resMode=sharp2&op_usm=3.0,0.3,2,0)
![Qatar’s Commercial Bank Chooses CrowdStrike Falcon®: A Partnership Based on Trust [VIDEO]](https://assets.crowdstrike.com/is/image/crowdstrikeinc/Edward-Gonam-Qatar-Blog2-1?wid=530&hei=349&fmt=png-alpha&qlt=95,0&resMode=sharp2&op_usm=3.0,0.3,2,0)


?wid=2048&hei=1350&fmt=png-alpha&qlt=95,0&resMode=sharp2&op_usm=3.0,0.3,2,0)


This blog was originally published April 29, 2021 on humio.com. Humio is a CrowdStrike Company. At Humio, our web client is written in Elm, a pure, functional programming language that compiles to JavaScript. This post provides a peek at what it’s like to work with Elm, by describing how I went about optimizing an Elm library. I share the process of identifying and improving the bottlenecks, and some of the pros and cons of the tools I used, so you can apply my lessons learned. The library I optimized is one we use to calculate the Levenshtein edit distance between two strings. The final tally of speedups are roughly between 1.3x to 2.4x.
Identifying the root cause
I optimized the Elm library, because we observed some slowdown in our client. When users search their logs, we provide a list of recent searches the user has performed, so they can come back to their previous searches. Users can also filter those searches. On our first pass of this feature, we had only done a naïve fuzzy search, including using the edit distance to narrow down which searches the user was looking for, and this solution wasn’t performing with real life data. I decided to load the recent searches with long, identical strings to stress the implementation and monitor the performance for bottlenecks.
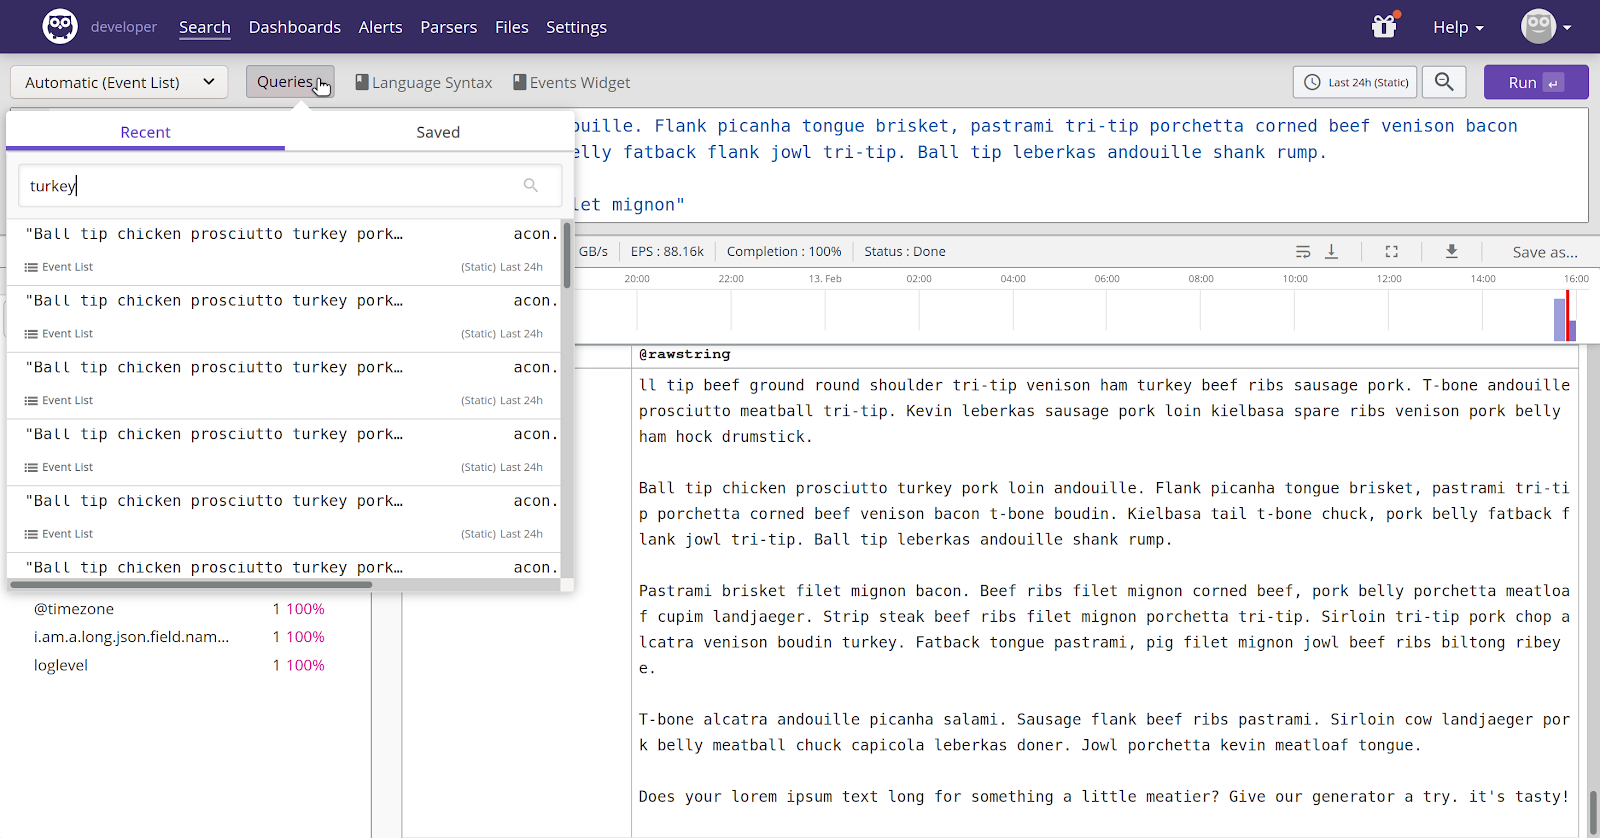 Our UI as it looked back then
Firing up the flame graphs in Firefox got me this: 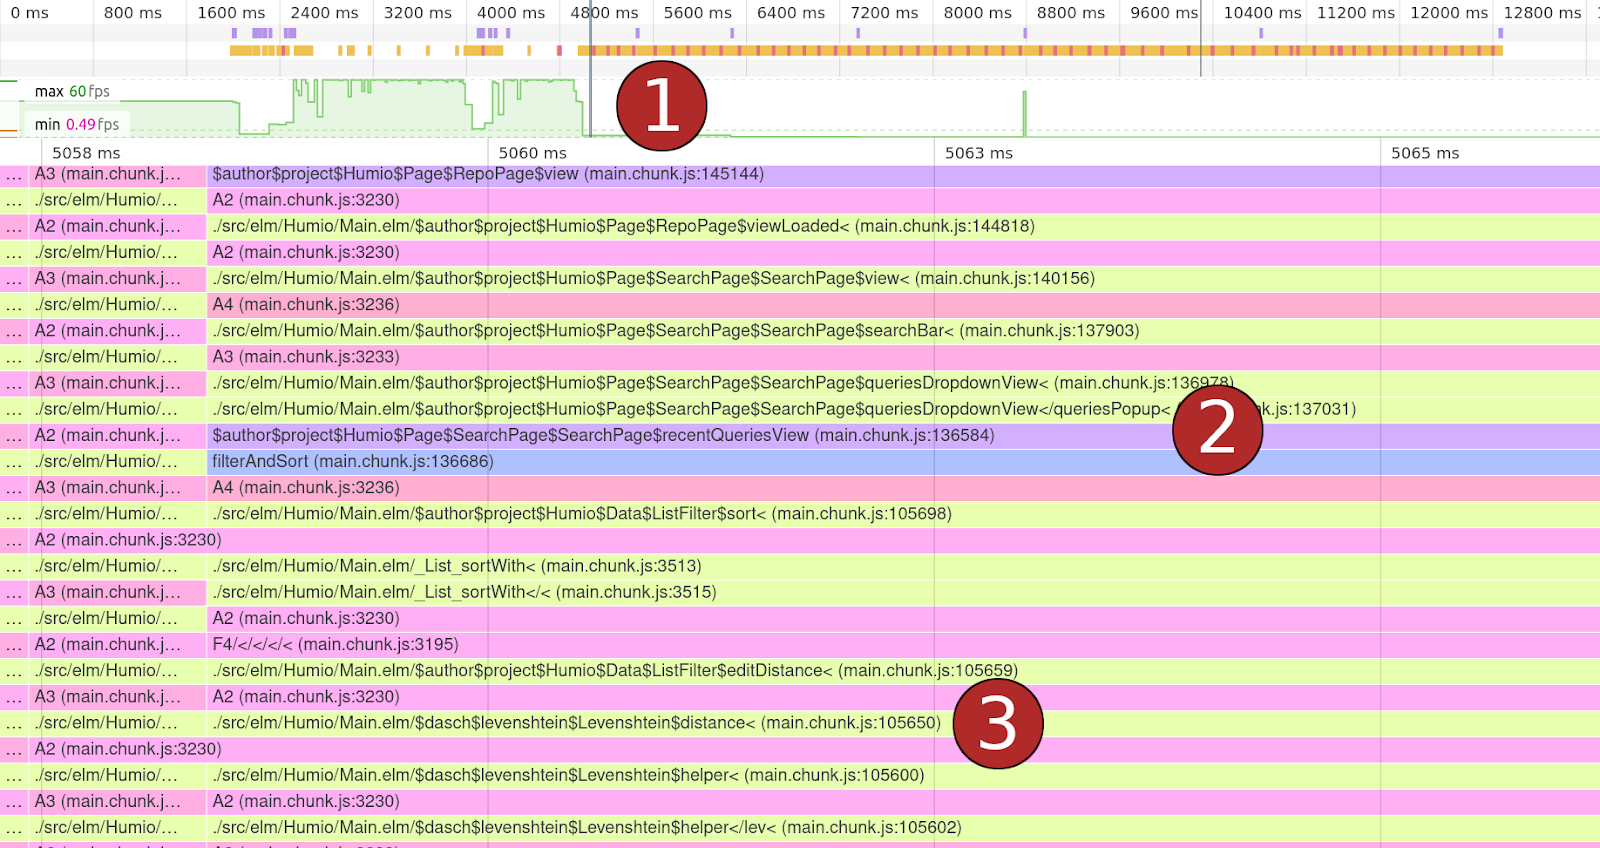 In the screenshot above:
- On the timeline, the green areas are where the browser has time to idle, and the white area is where it’s busy. The line there is the part of the execution that we have zoomed in on, which is just after I started typing in the search field and kept the browser as busy as it could be.
- Elm code compiles to JavaScript, but it doesn’t have source maps. Fortunately, the compiled code still keeps function names while we’re just debugging, and here we see that we’ve found the function that calculates what to show in the popup.
- And indeed, calculating what searches to show, seems dominated by calculating the edit distance for the various strings.
We still have to go further down to see what’s going on inside the library: 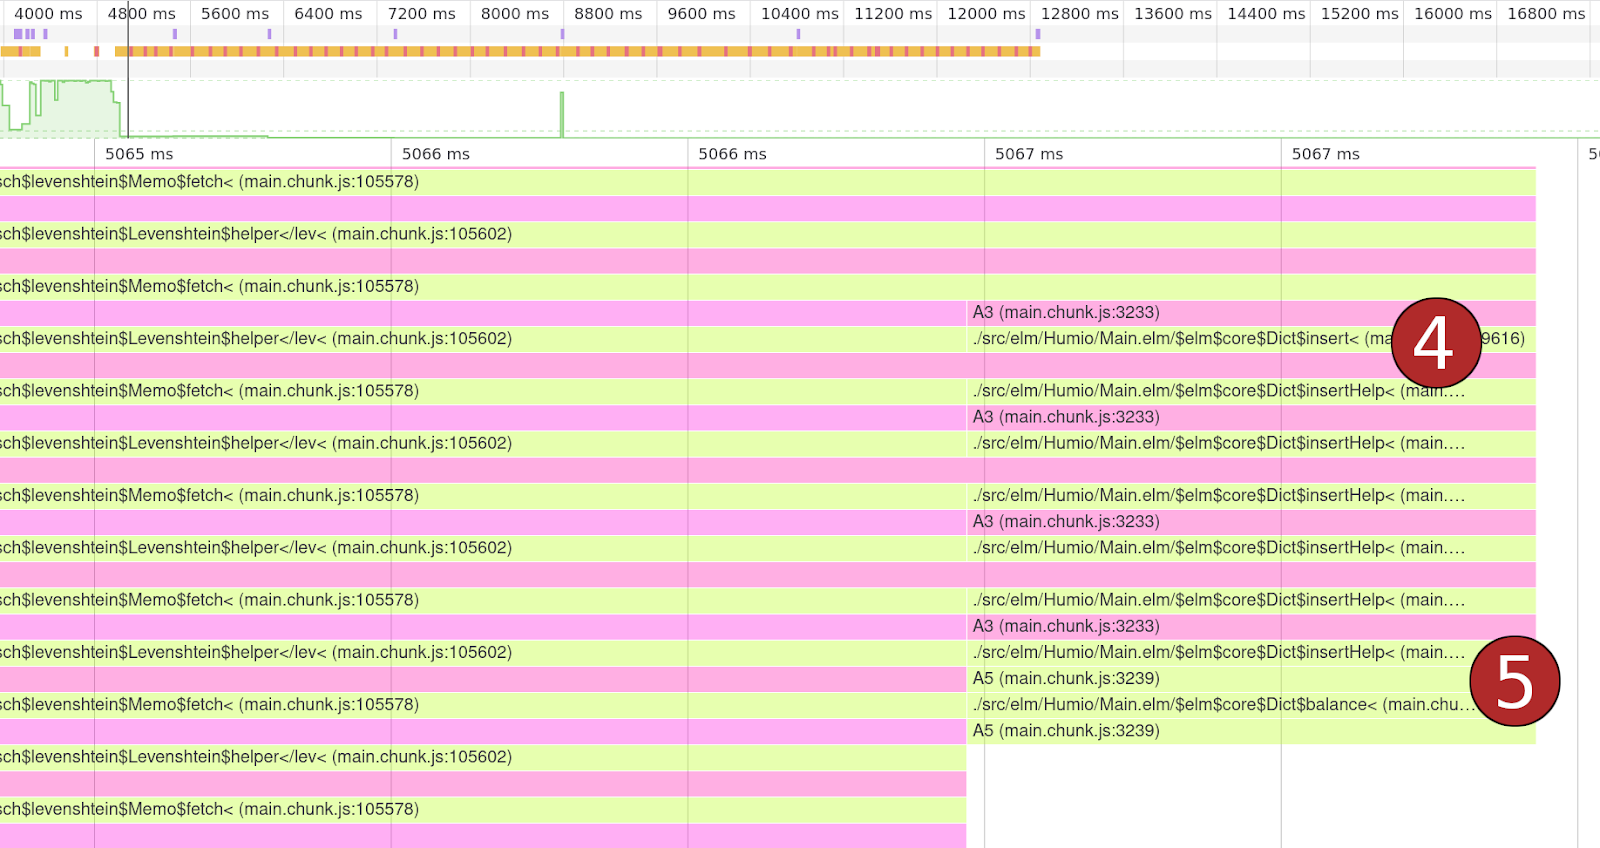 In the image above:
- Looking at the peaks in the flame graph, we can see that the library is, apparently, inserting something in a dictionary (an Elm hashmap).
- And this operation is often forcing the dictionary to re-balance its contents.
This suggests the Levenshtein calculation inserts a lot of elements with new keys in a dictionary. Looking at the code, we see the algorithm
between different chars. Using a dictionary to store the caching is logically sound, but as we can see here, it’s not all that efficient. Since we know exactly what elements the dictionary will come to contain (every combination of chars in the compared strings), it would be more efficient to construct the dictionary with the exact shape for all those elements up front. We can’t do that with Elm dictionaries, but we can do something different:
use an array, where each index in the array represents one of the char combinations we need.
We can create arrays of exactly the size we need up front, freeing us from moving data around as we add new combinations.
Solving the problem
The Levenshtein library fortunately takes advantage of some of the tooling that’s available in Elm: it comes with both
and
fuzz tests. This makes it easy to judge my code changes, both for performance and correctness. Having satisfied the fuzz tests, I was a bit disappointed to only see speedups in the 1.1-1.2x range (in both Firefox and Edge) for my array optimization. So I decided to try out some more ideas! In the end, most of my little experiments didn’t pass muster, either because they didn’t improve performance or they broke the implementation.
Except one: I moved some computations inside branches, to only compute things that were needed, which saw performance go through the roof. The best result came from the `worst case` benchmark running in Edge: with both my array and branch optimizations applied, calculating the edit distance was almost five times as fast as for the original code! At this point, I was mighty pleased with myself, and ready to call it a day. Until I remembered that I had been building the benchmarks without the `--optimize` flag, leaving me benchmarking unoptimized code. That’s no good of course, so I went back, and reran the two relevant benchmarks (`worst case` and `typical case`), three times each in both Edge (v85) and Firefox (v80), for the four scenarios (no optimizations, array caching, branch shuffling, and both optimizations). The benchmarks were run on my Surface Pro 4 (4GB RAM, i5-6300U, Windows 10). 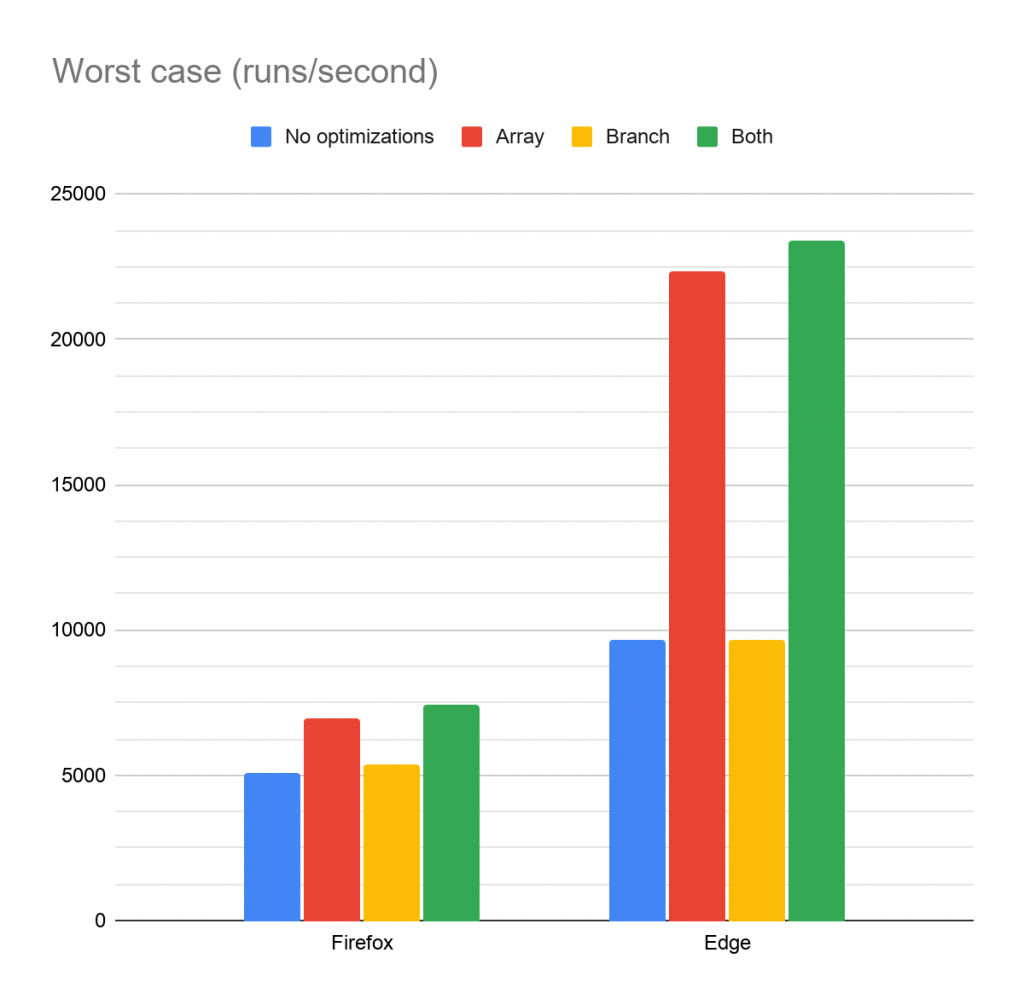
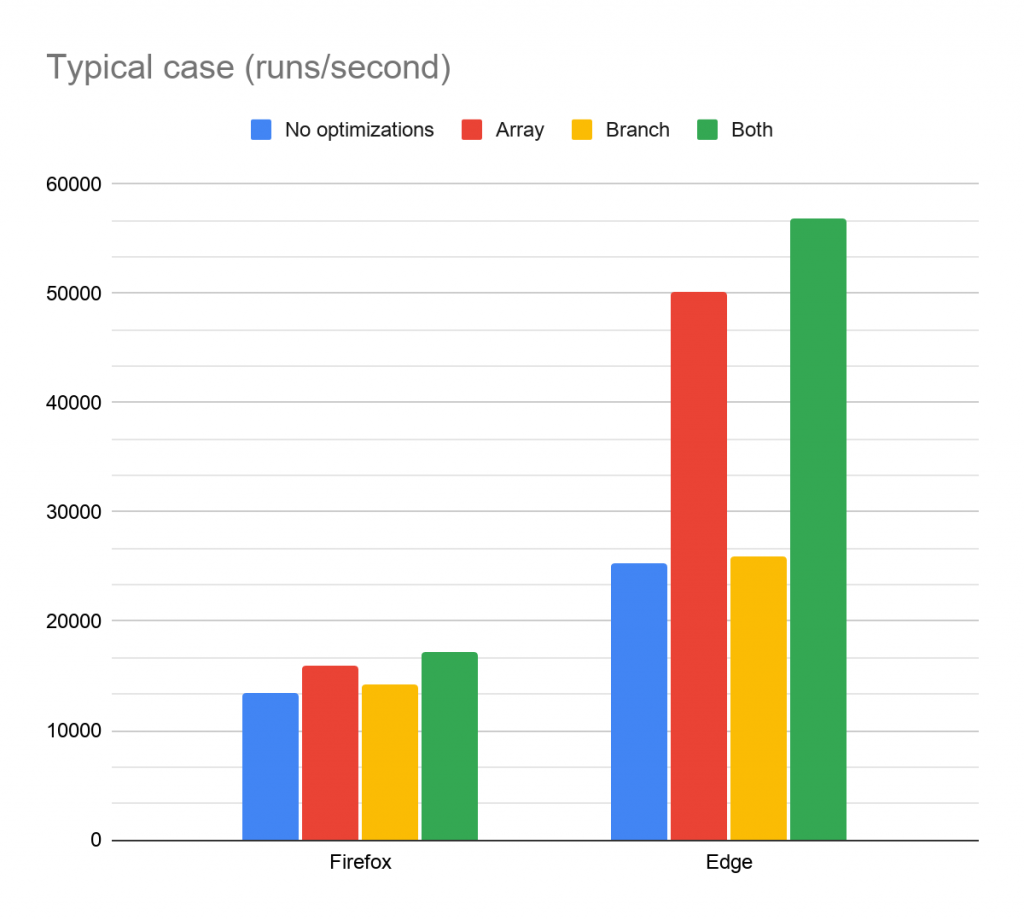 On Firefox, the boost from the array optimization has increased a bit (1.4x speedup for the worst case, and 1.2x for the typical), but Edge (and other V8-based browsers presumably) sees a big uplift (2.3x and 2x speedup for worst and typical cases). So that’s quite sweet, but on the other hand, my branch optimization went from being an extreme win, to being a small win at best. It’s interesting though, that the branch optimization alone makes no real difference in Edge, but combined with the array optimization, it still gives a tangible speedup. For the final tally (with both optimizations), in Firefox the calculation runs 1.5x as fast in the worst case, and 1.3x in the typical, while Edge runs the calculation with 2.4x and 2.2x speedups for worst and typical.
Tooling experience
I was fortunate that the library author had invested time into writing benchmarks and fuzz tests, which made it much easier for me to get started. For benchmarking, the experience is generally good, though there is room for improvement. The benchmarking harness is a library you can download and use from the Elm package repository, so it’s easy to get started. On the other hand, I went a long time before realizing that I was benchmarking unoptimized code, which is a poor user experience. I also found it somewhat painful to use benchmarking to actually explore performance. Since Elm code will run in the browser, the benchmarks also run in a browser window, with the results being rendered to a web page. This is reasonable, but there’s currently no way to export the results to, say, a CSV file. So “exporting” must be done manually, which is both tedious and error prone. In the end, I took screenshots of the benchmark results so I could transcribe any data I needed later and also be able to verify that I hadn’t mistyped anything.
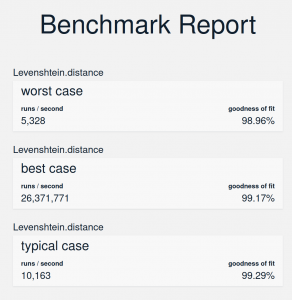 The results from running the benchmarks
I also kept all the versions of the code alive in the same set of benchmarks so I could be sure that I ran the same code in all my benchmarks. This gave me assurance that I ran the right code, but it had the downside of making the benchmarks very slow to run to completion. In that sense, it would be nice to have a way to tie a benchmark run to a specific version of the code so I’m always sure what code the results pertain to, even when I come back later. Having the ability to easily compare different result sets or even compile several results into a report would be immensely useful. As I wrote previously, I explored performance with many different combinations of setup (different code changes, both individually and combined, in different browsers, and running benchmarks multiple times for added confidence in the results), and iterating like that create a lot of friction today. The fuzz tests were a real confidence booster though, since they showed me that many of my changes turned out to be wrong. It’s very nice that the fuzz tests are part of the normal test harness. Running the fuzz tests is as easy as running unit tests. And when the tests pass, the tests run quickly too. I had one test that I often broke though, and unfortunately, every time it was broken, it would take ages to produce an answer to why it was failing. In the end, I resorted to simply cancelling the test run whenever I could tell it was failing and iterating on my code instead. Trusting fuzz tests blindly is dangerous too, as I actually ended up
anyway. If I had been looking more closely at the coverage of the tests, I might have caught it, but that’s no fault of the tests of course. Unfortunately, there’s not really a great story around measuring coverage for Elm tests today, so it requires more diligence from the developer.
Conclusion
In the end, we made our fuzzy search perform better through a number of changes, with these optimizations being a small part of the story. Doing the optimizations was mostly a good experience, and the only painful parts were working with benchmark results across different permutations and forgetting to optimize them. There’s a number of avenues I didn’t go down that might still be relevant, such as how does a code change affect memory use? Or the size of the minified deliverable? And does minification affect the benchmark results? For my changes here, I assume memory use is at least down a little, and the final size of the code is up a bit, but that’s conjecture. And I have no idea if minification affected performance in any way. There’s still a number of ways the tooling can go to give more data and confidence about the results from any optimizations you may want to make.
