Importing Logs from Logstash into Falcon LogScale
Logging is an important tool in the cloud developer’s toolbox. It can be the critical component used to discover why your authentication service can’t connect to its database or why your API gateway is not routing upstream traffic correctly.
Today, humans are not the only ones reading logs. Machines are also participating in the logging landscape by helping identify patterns (and outliers) in your system logs.
Logstash is a log shipper: a tool that aggregates system logs from a variety of sources on a single host and transmits them to another host. Logstash also allows for filtering and transforming logs into different formats. This helps produce more machine-readable logs since you can transform all your disparate logs into a common schema. The ability to ship logs to another system helps collect all the information across your cloud systems in a single repository for data management and analytics.
CrowdStrike Falcon® LogScale is a logging management and analysis tool that helps you unify the logs from the disparate systems across your entire ecosystem. Those systems include:
- Kubernetes clusters
- Databases
- Microservices
- Message brokers
- Any other infrastructure running on-premises or in the cloud
LogScale can ingest logs from multiple Logstash (or other) sources and process them further, providing a much wider view of your cloud infrastructure. Searching for particular logs or sets of logs across systems is made easier via Falcon LogScale’s querying language.
In this guide, we’ll demonstrate how to set up Logstash for collecting logs on your system and shipping them to LogScale for aggregation and analysis.
Getting started with Logstash
Logstash is typically used to collect all the logs from a particular system and funnel them into a single stream of data that can be filtered and shipped further upstream. The final destination for these aggregated logs may be multiple places:
- ElasticSearch (Logstash and ElasticSearch belong to the same parent company)
- A data lake
- An archive database
- Another instance of Logstash
- A cloud log aggregator such as LogScale
How to set up Logstash
The following instructions are for using Logstash 8.2.3 on a Linux-based operating system using kernel version 5.18. Logstash depends on Java 11. Make sure you have this installed on your system.
The Logstash documentation details how to install its binaries on package-based Linux distros. On a macOS system with the Homebrew package manager, you can simply use brew install logstash.
If there is no package for your particular flavor of Linux, then you should still be able to download a binary directly and install it in a safe place like /opt.
The following bash snippet illustrates that process:
wget \ https://artifacts.elastic.co/downloads/logstash/logstash-oss-8.2.3-linux-x86_64.tar.gz


tar xvzf logstash-oss-8.2.3-linux-x86_64.tar.gz


sudo mv /logstash-8.2.3/* /opt/logstash/
Configuring Logstash
We’ll configure Logstash to tail the Apache2 access logs, outputting any new lines to stdout. This is an easy way to ensure you have Logstash installed correctly and can capture logs properly. Create a file named logstash-stdout.conf with the following contents:
input {
   file {
      path => "/var/log/apache2/access_log"
      type => "apache"
   }
}

output {
    stdout { codec => json }
}
You can see the file is divided between two configuration objects: input and output. Both objects can take many different potential values. In our example, however, we are simply tailing a file in the input and sending the output, formatted as JSON, to stdout.
You may need to change the path location to the folder containing Apache2 access logs on your machine.
More details and options related to the configuration can be found in the Logstash documentation.
Starting up Logstash
To start Logstash with this configuration, run the following command as root:
<path to installation>/logstash \
-f <path to configuration>/logstash-stdout.conf
You should begin to see many diagnostic logs in your console, indicating that Logstash has started up and read in the configuration options. Next, hit your Apache2 server to generate a new entry in the access logs.
You should see a new console log indicating that Logstash has picked up the change in the access logs file, redirecting the new entry to stdout as JSON. In the console where you started Logstash, you should see something like the following:
{
  "event": {
    "original": "2605:a601:a982:0:150c:7494:bd41:a668 - - [28/Jun/2022:21:30:04 -0600] \"GET / HTTP/1.1\" 200 - \"-\" \"Mozilla/5.0 (Macintosh; Intel Mac OS X 10_15_7) AppleWebKit/605.1.15 (KHTML, like Gecko) Version/15.5 Safari/605.1.15\""
  },
  "log": {
    "file": {
      "path": "/var/log/apache2/access_log"
    }
  },
  "@version": "1",
  "host": {
    "name": "<your-hostname>"
  },
  "type": "apache",
  "@timestamp": "2022-06-29T03:30:04.852654Z",
  "message": "2605:a601:a982:0:150c:7494:bd41:a668 - - [28/Jun/2022:21:30:04 -0600] \"GET / HTTP/1.1\" 200 - \"-\" \"Mozilla/5.0 (Macintosh; Intel Mac OS X 10_15_7) AppleWebKit/605.1.15 (KHTML, like Gecko) Version/15.5 Safari/605.1.15\""
}
The output above has been reformatted for readability using the jq utility and will appear as a single line in the console.
Getting started with Falcon LogScale
Falcon LogScale provides a single location for the current logs and statuses of all your systems. It allows you to cross-reference events and data points across resources. This is invaluable for outlier detection and outage root cause analysis.
With LogScale, you could identify that a slow endpoint on an authentication service is causing a 500 error in a completely different service. Looking at each individual system’s logs in isolation is often not enough to diagnose issues like this.
In order to fully leverage the power of Falcon LogScale, we need to send our system logs to LogScale.
Creating a LogScale account
The first step is to register an account with Falcon LogScale. There are tiers ranging from free trials to unlimited log ingestion. Choose the level that suits the needs of your organization. For this guide, you can get by with the Falcon LogScale Community Edition. Note: it may take up to two days to activate your new LogScale account.
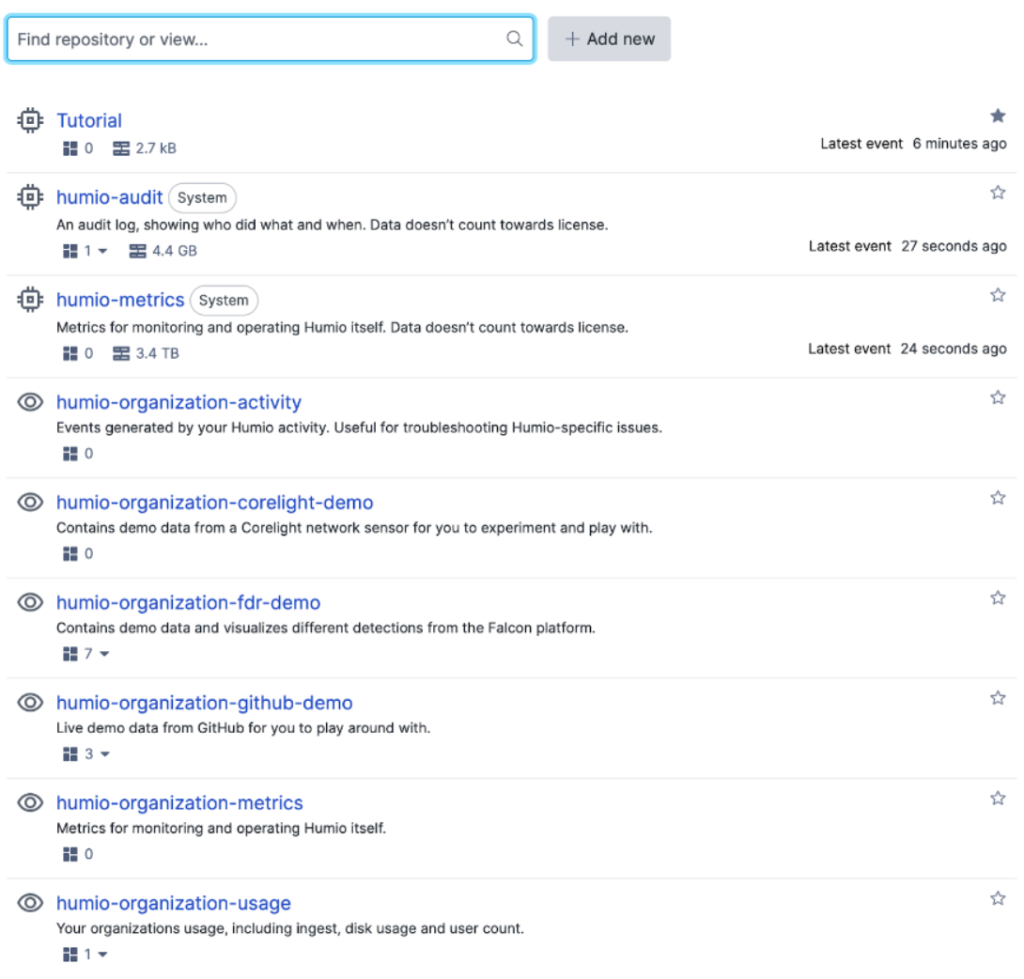
Once you’ve created an account and logged in, navigate to the “Repository” list as shown in the image below:
Set up a LogScale repository
A “repository” in LogScale is the base layer for organizing data. You can add users, dashboards and logs to a repository. In the image above, we created a repository named “Tutorial” for this demo.
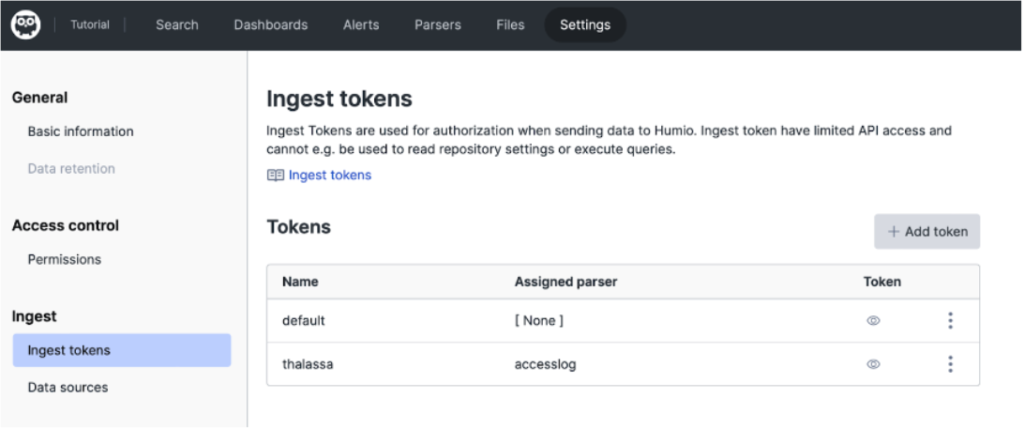
After you have created a new repository, you will need an ingest token to send logs from Logstash to your Falcon LogScale repository. The ingest token authenticates the log shipper, verifying that it is authorized to send logs to your Falcon LogScale repository.
When you navigate to your repository for the first time, you’ll be asked to create an ingest token. If you don’t create an ingest token at that time, you can always go to the Settings tab, then navigate to Ingest Tokens.
Integrating Logstash with Falcon LogScale
After setting up your LogScale repository, the next step is to configure Logstash to send the logs it collects from your system to LogScale. Currently, we have Logstash set up to send logs to stdout, so we’ll want to change that destination.
There are at least two ways to ship logs from Logstash into LogScale:
- Use the built-in HTTP output plugin from Logstash.
- Use the OpenSearch output plugin, which is a third-party plugin but does not ship standard with Logstash.
In this guide, we’ll use the built-in HTTP output plugin. First, we create a new configuration file named logstash-humio.conf, which should contain the following:
input {
   file {
      path => "/var/log/apache2/access_log"
      type => "apache"
   }
}

output {
  http {
    url => "https://cloud.community.humio.com/api/v1/ingest/raw"
    http_method => "post"
    ssl_verification_mode => "full"
    cacert => '<your-certificate-path>/ca-bundle.pem'
    headers => [
        'Authorization', 'Bearer <your-ingest-token>'
    ]
  }
}
Note: there are several places in the configuration file that need to be updated with your particular information:
- If you’re using Falcon LogScale Community Edition, then this is the correct URL to use. The domain may change depending on your LogScale account type. You can reference LogScale’s documentation on Endpoints for details.
- To use SSL security, you’ll need to provide the path to your local certificate. This can vary across different distributions.
- You’ll need to provide the LogScale repository ingest token you created above.
Setting up a LogScale parser
The above Logstash configuration will correctly ship logs to Falcon LogScale. However, since the logs are being shipped via raw HTTP output, they will not be parsed as JSON objects within the LogScale repository. To get the full power of LogScale’s querying language, we use a parser to convert the Logstash payloads to JSON within LogScale.
Falcon LogScale provides a nice parser creation tool, accessible via the top navigation bar in your repository:
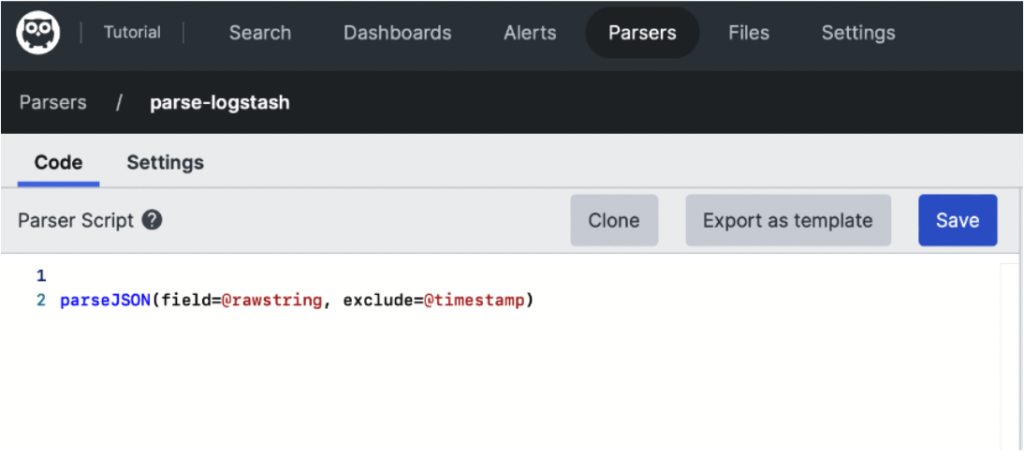
In the image above, we see an example parser for correctly interpreting the Logstash request as JSON with direct access to member fields. The configuration of the parser is:
parseJSON(field=@rawstring, exclude=@timestamp)
The LogScale parser is powerful. Explore the documentation for additional configurations that may better suit your use case. After you create a parser, you must assign it to an ingest token for it to be applied to the Logstash data. After connecting your parser, you’ll begin to see data like the following in your LogScale Repository:
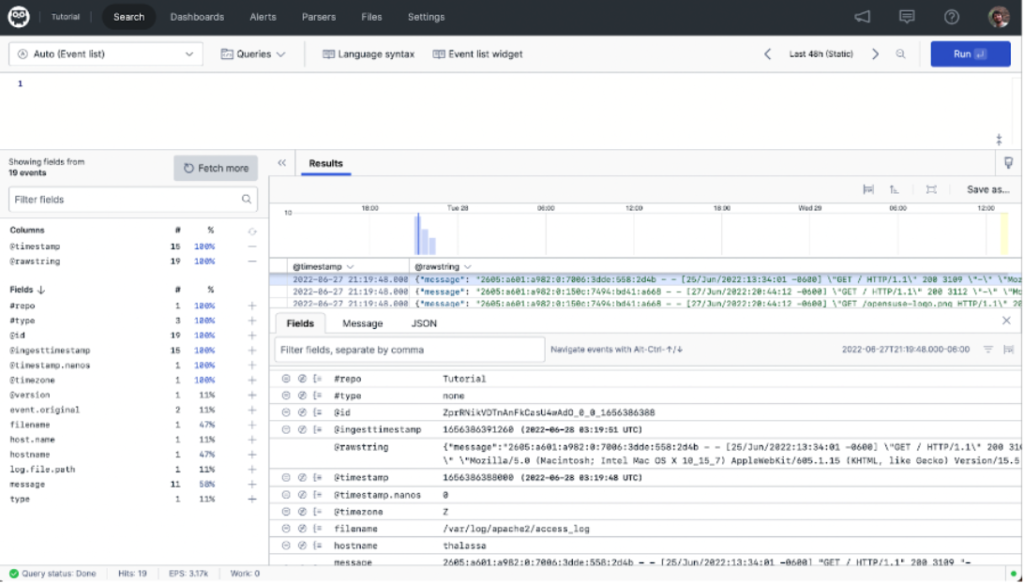
In the center pane, it’s clear the parser is correctly pulling out the individual fields of the JSON body coming from Logstash into individual terms in LogScale. With logs properly parsed, you’ll be able to craft queries to identify the specific logs for each use case.
Conclusion
In this how-to guide, we demonstrated how to configure Logstash to ingest logs from a single system and ship those logs to Falcon LogScale. In our particular example, Logstash was configured to tail and transform Apache2 access logs. We set up a LogScale repository, configuring it to accept requests from Logstash using ingest tokens. We applied a parser to those requests for better data organization. Lastly, we demonstrated how to view these logs in LogScale.
Connecting Logstash to Falcon LogScale is simple and straightforward. If your organization already uses Logstash as part of its stack, or if you’re just getting started, you now have a new option for a backend to collect and store those logs for powerful querying and analysis.