In the previous section of this Node.js logging series, we discussed how centralizing log data helps you better access and analyze logs across all your system components, providing insightful information on the functionality, reliability, and security of a system or application.
Numerous logging libraries and packages, such as winston and pino, offer rich features and capabilities for logging. However, logging within frameworks like Express can present several challenges. Express is a backend web application framework widely used to build APIs with Node.js. In this article, we’ll discuss logging with the Express framework and its integration with CrowdStrike Falcon LogScale for centralized logging.
Learn More
- Part 1: Basic Concepts
- Part 2: Advanced Concepts
- Part 3: Centralizing Node.js Logs
- Part 4: Logging in Express Applications
The Challenges of Logging within Frameworks
Several difficulties can arise when handling logging in applications built with frameworks like Express.
Handling log volume
Express apps can produce a lot of log data, especially in environments with heavy traffic. For example, an e-commerce website with an increase in user actions, such as browsing products and adding items to their cart, can lead to an explosion in log volume. Without the proper tools and procedures in place, the volume of logs generated intensifies the challenge of managing and analyzing your logs.
Consistent log formatting
For distributed systems with various microservices, consistent and reliable log gathering requires coordination. For example, to monitor the performance of an e-commerce site, we need to collect log data from all the independent services—product catalog, payment gateway, notifications service—and process it to extract insights and identify problems. Undoubtedly, each service may have its own format and approach for logging. Unifying all of these formats to enable efficient processing can be difficult.
The impact of logging on application performance
Organizations must balance the need for detailed and granular log data with the desire to avoid generating excessive log data, which can impact the performance and scalability of an application. Therefore, we only need to gather the log data that’s sufficient to monitor the platform’s performance and identify related issues.
Handling redundant logs
Logs must handle duplicate or redundant logs effectively, as applications sometimes generate duplicate logs if multiple logging handlers are recording log messages. For example, a Node.js application can have a file handler and an HTTP handler, resulting in a process that logs identical messages to two separate destinations. If a centralized server ingests logs from both sources, it might accumulate duplicate logs.
Encrypting or redacting logs
Log data can be sensitive and valuable, so it must be appropriately redacted or encrypted and protected from unauthorized access or tampering. For example, a healthcare website contains sensitive data (such as patient names and medical histories) and requires secure log management tools and access controls.
To tackle many of these challenges, enterprises employ a centralized logging system, such as CrowdStrike Falcon LogScale, which provides a scalable, high-performance platform for collecting, storing, and analyzing log data. Let’s look at how this might work within a Node.js Express application.
Understanding Logging in Node.js Applications
Node.js applications capture various log types depending on the needs and requirements of the application.
Log types
The following list shows common log types that may be relevant to Node.js applications, as well as the levels typically associated with each log type:
- Application logs: Request and response logs, including application-specific events and activities such as data transfers, successful database connections, or file access.
- System logs: Generated at the level of the operating system or other system components, such as the kernel, the filesystem, and the network stack.
- Access logs: Includes user access and authentication events, including failed login attempts, password changes, and session timeouts. These also include details on security-related occurrences, such as hacking attempts, malicious behavior, and data breaches.
- Error logs: Failures and exceptions within the application, such as runtime errors, syntax errors, and unhandled exceptions.
- Performance logs: Data that includes network traffic, CPU and memory usage, and request and response times.
The following table shows the uses and log levels from various sources.
| Source | Uses | Log Levels |
|---|---|---|
| Application Logs | Provides valuable insights into the app's behavior and performance. Can be used for various purposes, including monitoring, troubleshooting, and analysis. | info, debug, warning |
| System Logs | Provides information about the system's overall health and status, and any issues or errors affecting the application. | info, warning, error |
| Access Logs | Valuable for user activity monitoring and security audits, offering useful information on the security and integrity of the app. Also helps in forensic analysis, compliance reporting, and security incident response. | info, debug, warning, error, critical |
| Error Logs | Used for debugging and troubleshooting, and to gain useful insights into the causes and effects of failures. | error, fatal |
| Performance Logs | Used in performance monitoring and optimization. | info, debug, warning |
Logging within a Node.js Express Application
To add logging to an Express application, use a logging library or middleware that integrates with the framework, such as winston. Winston is a popular Node.js logging library that offers a simple and flexible API for logging messages. Additionally, it supports multiple transports for storing and outputting log messages, such as the console, a file, or a remote logging service.
Let’s demonstrate how to add logs to an Express application with winston.
Instantiating an Express Server
First, we instantiate an Express server with a default GET route, and we start up the server to listen on port 3000.
const express = require("express");const app = express();
const port = 3000;
app.listen(port, () => {
console.log(`App listening on port ${port}!`);
});
Install a logging library
Next, we install a logging library that is compatible with Express. We’ll use winston.
npm install express winston
Configure the logger
We configure the logger to output log data in the desired format, setting a log level and a destination (such as a log file, the console, or a remote log server).
const winston = require("winston");const logger = winston.createLogger({
level: "info",
format: winston.format.json(),
transports: [
new winston.transports.Console(),
new winston.transports.File({ filename: "logs/app.log" }),
],
});
Add log statements to the application
Then, we add log statements in the application to log the desired information.
app.get("/", (req, res) => {logger.log("info", "Request received: ", req);
res.send("Hello, world!");
});
Below is the complete code example to integrate logging with winston in our Express application.
const express = require("express");const winston = require("winston");
const app = express();
const port = 3000;
const logger = winston.createLogger({
// Log only if level is less than (meaning more severe) or equal to this
level: "info",
// Use timestamp and printf to create a standard log format
format: winston.format.combine(
winston.format.timestamp(),
winston.format.printf(
(info) => `${info.timestamp} ${info.level}: ${info.message}`
)
),
// Log to the console and a file
transports: [
new winston.transports.Console(),
new winston.transports.File({ filename: "logs/app.log" }),
],
});
app.use((req, res, next) => {
// Log an info message for each incoming request
logger.info(`Received a ${req.method} request for ${req.url}`);
next();
});
// Handle HTTP GET requests to the root path
app.get("/", (req, res) => {
// Log messages at different log levels
logger.log("error", "This is an error message");
logger.log("warn", "This is a warning message");
logger.log("info", "This is an info message");
logger.log("verbose", "This is a verbose message");
logger.log("debug", "This is a debug message");
logger.log("silly", "This is a silly message");
// Send a response to the client
res.send("Hello, world!");
});
// A route for manually triggering an error
app.get("/error", (req, res, next) => {
throw new Error('This is a test error');
})
// Handle errors using the logger
app.use((err, req, res, next) => {
// Log the error message at the error level
logger.error(err.message);
res.status(500).send();
});
// Start the app and listen on the specified port
app.listen(port, () => {
logger.log("info", `App listening on port ${port}!`);
});
In the above example, we use the winston module to create a logger and add it to the Express app as middleware. We also handle errors and log them usinglogger.error.
The winston logger instance is created at theinfolog level, so it only logs messages at the info level or lower. With winston, log level severity increases with each lower level. So, this means error, warn, and infomessages will be logged, but verbose, debug, and silly messages will not.
We configured winston to use the timestamp and printfformatters to create a standard log format that includes a standardized timestamp, the log level, and the message. Then, we set up our logger to use two transports, logging messages to the console and to a file called logs/app.log.
When a route receives an incoming request, the logger logs details about the request (such as the request method and URL) and the response status code. This is useful for debugging and troubleshooting.
By logging messages at different log levels throughout the code, a developer can include different information types in the logs with higher-severity messages to alert with critical information. We’ve created an example route (/error) that deliberately throws an error. By logging errors in error-handling middleware, developers can track the flow of their code and identify the cause of the error.
Test run
On starting up the application with node index.js, the following information is logged:
2022-12-08T11:10:29.674Z info: App listening on port 3000!
When we send a request to /, the following information is logged:
2022-12-08T11:10:35.686Z info: Received a GET request for /2022-12-08T11:10:35.687Z error: This is an error message
2022-12-08T11:10:35.688Z warn: This is a warning message
2022-12-08T11:10:35.689Z info: This is an info message
Next, if we hit the /error route, the following information is logged:
2022-12-08T11:12:08.838Z info: Received a GET request for /error2022-12-08T11:12:08.839Z error: This is a test error
We have successfully integrated winston for logging within our Express application! The next step is to push our application logs to a centralized logging server.
Integrating with CrowdStrike Falcon LogScale
To integrate the code from the previous example with Falcon LogScale, we use the humio-winston npm package. First, we install the package.
npm install humio-winston
Next, we import the transport from the package.
const LogScaleTransport = require("humio-winston").default;We create an instance of the transport, then configure it with an ingestToken that we get from our LogScale account.
// create a humio transportconst logscaleTransport = new LogScaleTransport({
ingestToken: "<YOUR_INGEST_TOKEN>",
callback: (err) => {
if (err) {
console.error("Failed to send log to Humio: " + err.message);
}
},
});
We add the logscaleTransport instance to the list of transports for our logger.
// Create a logger instanceconst logger = winston.createLogger({
level: "info",
format: winston.format.combine(
winston.format.timestamp(),
winston.format.printf(
(info) => `${info.timestamp} ${info.level}: ${info.message}`
)
),
transports: [
new winston.transports.Console(),
new winston.transports.File({ filename: "logs/app.log" }),
logscaleTransport
],
});
Note that the humio-winston package is hardcoded with an API_BASE_URL of https://cloud.humio.com, and this may not be the correct ingest endpoint for you, depending on the type of account you have with Falcon LogScale. For example, if you use the Community Edition of Falcon LogScale, then the API_BASE_URL should be https://cloud.community.humio.com . You can change the value used in the library by editing node_modules/humio-winston/dist/humio-winston.js.
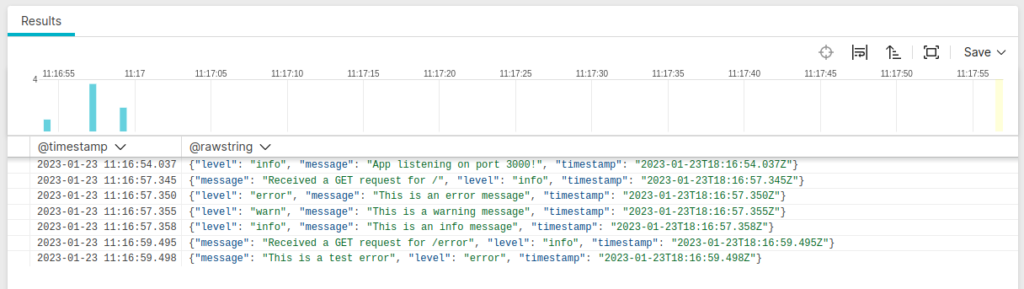
With these changes, the logger sends log messages to the console, the log file, and Falcon LogScale. We can go through the same test run and then verify in our log data repository at Falcon LogScale that log messages have arrived.
Log your data with CrowdStrike Falcon Next-Gen SIEM
Elevate your cybersecurity with the CrowdStrike Falcon® platform, the premier AI-native platform for SIEM and log management. Experience security logging at a petabyte scale, choosing between cloud-native or self-hosted deployment options. Log your data with a powerful, index-free architecture, without bottlenecks, allowing threat hunting with over 1 PB of data ingestion per day. Ensure real-time search capabilities to outpace adversaries, achieving sub-second latency for complex queries. Benefit from 360-degree visibility, consolidating data to break down silos and enabling security, IT, and DevOps teams to hunt threats, monitor performance, and ensure compliance seamlessly across 3 billion events in less than 1 second.
Arfan Sharif is a product marketing lead for the Observability portfolio at CrowdStrike. He has over 15 years experience driving Log Management, ITOps, Observability, Security and CX solutions for companies such as Splunk, Genesys and Quest Software. Arfan graduated in Computer Science at Bucks and Chilterns University and has a career spanning across Product Marketing and Sales Engineering.