Effective log management is an important part of system administration, security, and application development. In this first post of our Windows Logging Guide series, we will begin with the basics: Event Viewer. Event Viewer is one of the most important basic log management tools an administrator can learn for Windows logging.
Event Viewer aggregates application, security, and system logs, enabling administrators to trigger automation based on specific events. As we examine Event Viewer, we’ll look at what it is, how events are categorized, and how to read log messages.
Learn More
- Part 1: The Basics
- Part 2: Advanced Concepts
- Part 3: Logging With IIS and SQL Servers
- Part 4: Centralizing Logs
What is Windows Event Viewer?
Windows Event Viewer is a Windows application that aggregates and displays logs related to a system’s hardware, application, operating system, and security events.
Windows Event Viewer entries are grouped into different categories and stored as event log messages. Each event log message contains a variety of parameters including the Event ID, the message timestamp (Logged), the Source of the message, the Level of severity, and other descriptive information about the event.
While most Windows event logs don’t impact core functionality and can be ignored for basic day-to-day use, they are valuable in the right context. For example, administrators can use these messages to troubleshoot problems or audit security events.
Expert Tip
Event Viewer is often abused by scammers. Event Viewer is a useful system administration and troubleshooting tool because it provides detailed logging information. Unfortunately, as part of tech support scams, scammers have abused the frequency of warning and critical messages in logs to trick people unfamiliar with Event Viewer.
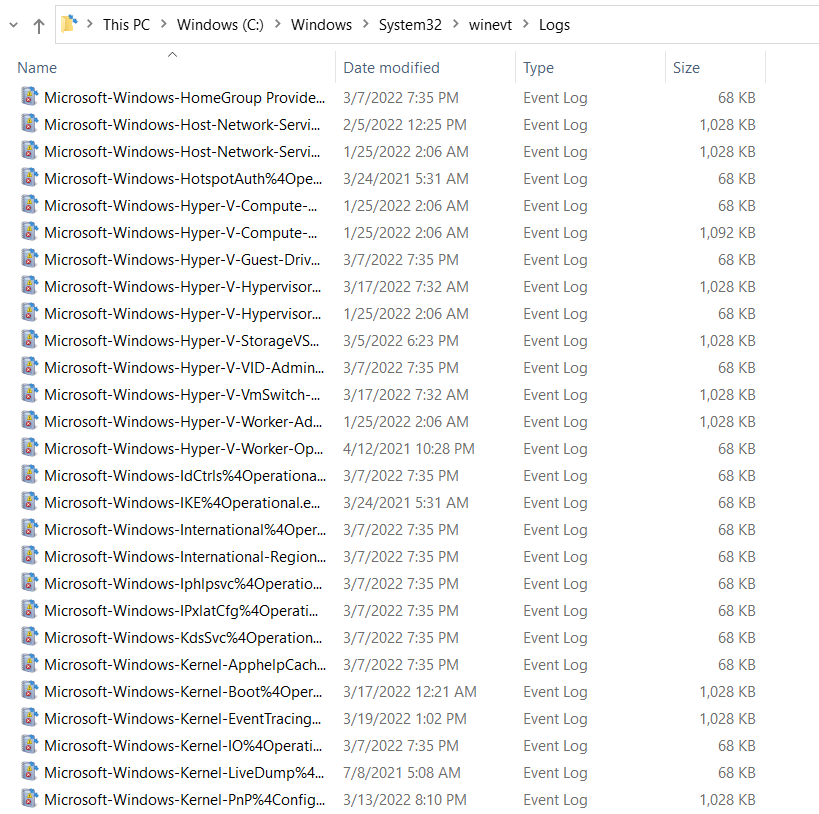
By default, the Windows Event Viewer log files have a .evtxextension (for example Application.evtx) and are stored in %SystemRoot%System32winevtLogs (usually C:WindowsSystem32winevtLogs).
How to access Windows Event Viewer?
There are multiple ways to access Windows Event Viewer on a Windows machine. In many cases, the fastest way is to:
1. Press the ⊞ Win + R keys to launch a Run prompt.
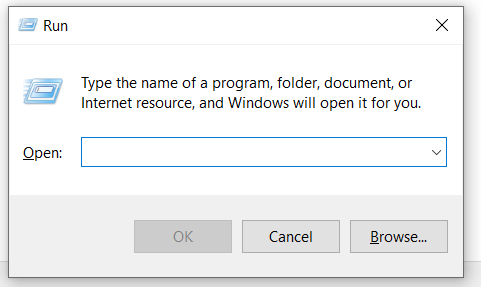
2. In the Run prompt, type eventvwr(or eventvwr.msc) and press enter.
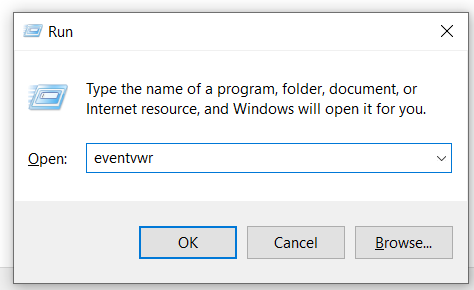
Event Viewer will launch.
Let’s take a look at other common methods for accessing Event Viewer.
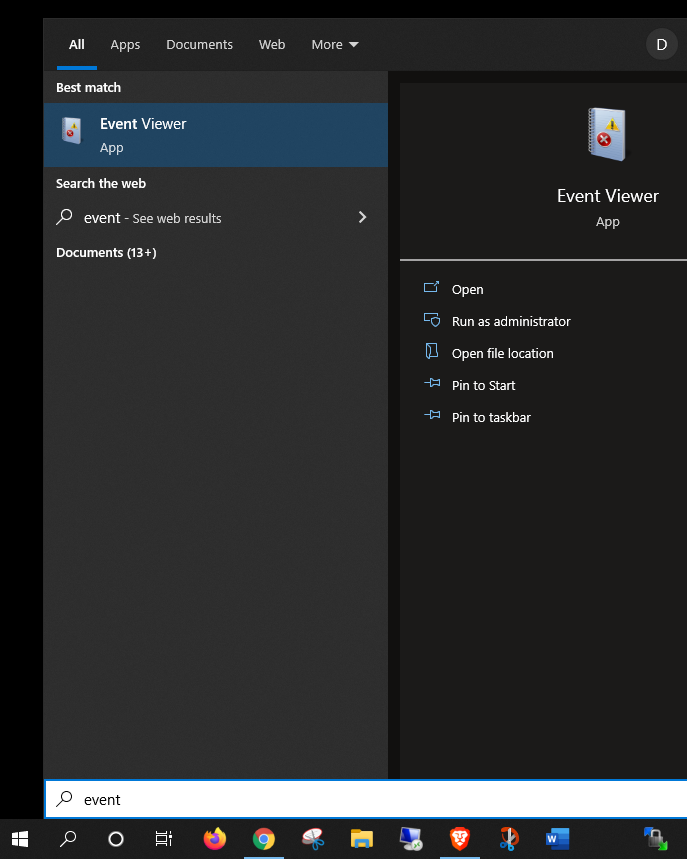
Windows Search
On most modern Windows operating systems with a desktop GUI, you can search for the phrase “event” and launch the Event Viewer app directly from the search results.
Control Panel
You can launch Event Viewer from the Windows Control Panel at:
Control PanelAll Control Panel ItemsAdministrative ToolsEvent Viewer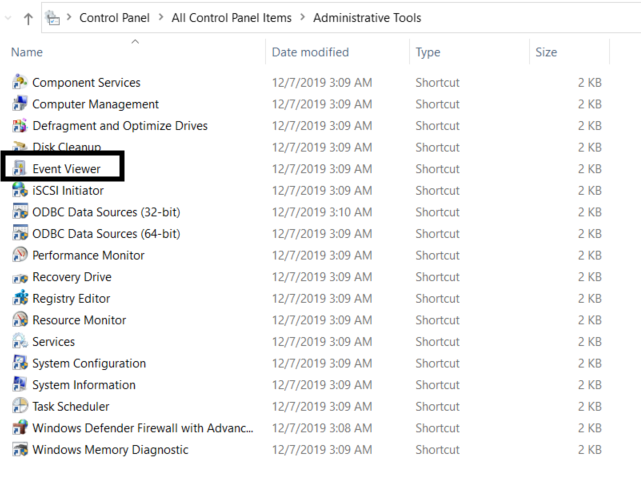
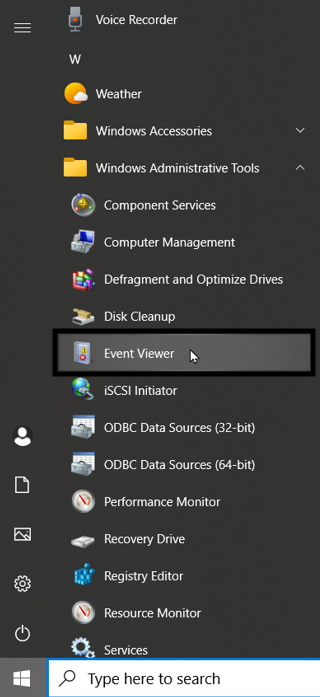
Start menu
You can also launch Event Viewer from the Windows Start Menu at Windows Administrative Tools → Event Viewer.
Command prompt and PowerShell
Both the Windows command prompt ( cmd.exe) and PowerShell allow you to launch Event Viewer with both the eventvwr and eventvwr.msc commands.
Additionally, you can use PowerShell to work directly with Windows logging entries in the event Log. We’ll take a closer look at that topic in Part Two of our Windows Logging Guide.
Server Manager
To use Server Manager to access Event Viewer, first click Tools in the upper right corner. Then, click Event Viewer in the menu.
How to use Event Viewer to connect to remote Windows Machines
By default, the Windows Event Viewer application connects to your local machine. However, you can also use it to view event logs on remote Windows machines. To do this, launch Event Viewer and click Action → Connect to Another Computer. Then, input the information for the remote machine.
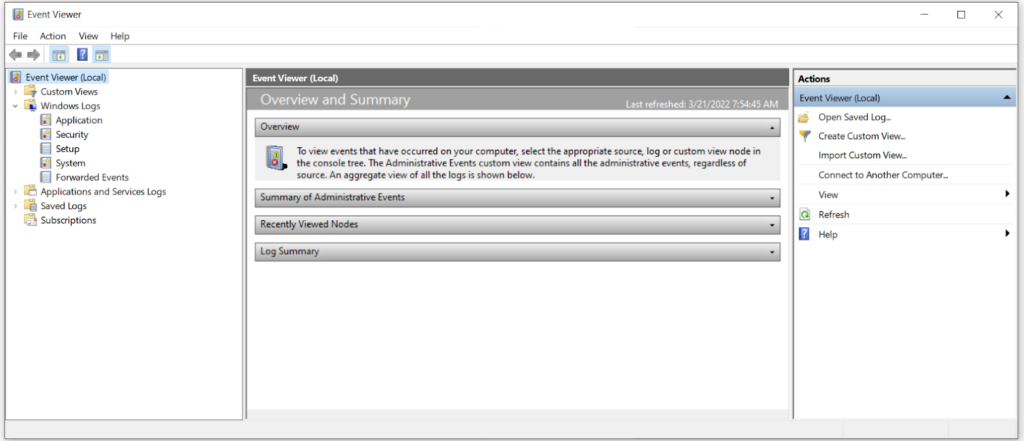
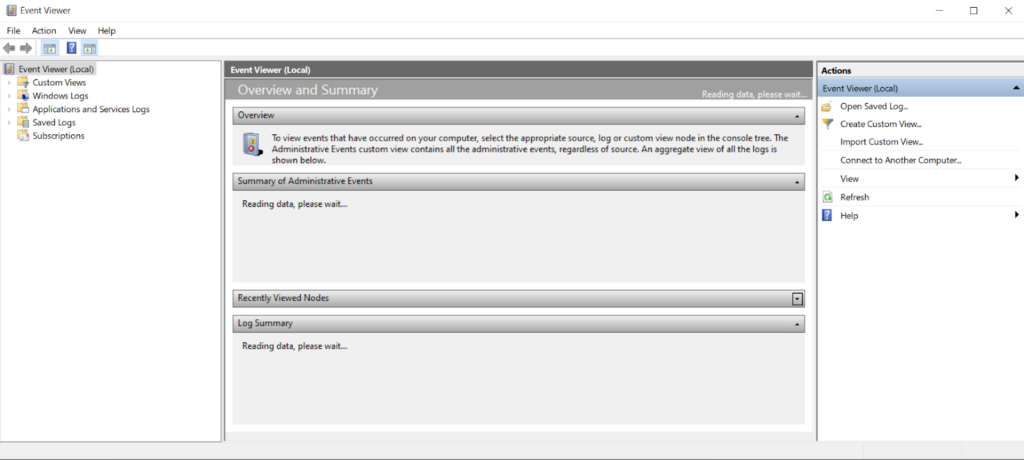
The Windows Event Viewer Interface

The Event Viewer GUI consists of three main components:
- The Navigation Pane lets you select different log views to display in the Details Pane.
- The Details Pane displays the contents of event logs.
- The Actions Pane lets you perform different log-related actions, such as creating custom views, filtering, searching, clearing, exporting, and saving logs.
How event logs are categorized
To get the most out of Windows logging, it’s useful to understand how events are grouped and categorized. At a high level, Event Viewer groups logs based on the components that create them, and it categorizes those log entries by severity.
Overview of the Windows and Applications and Services logs
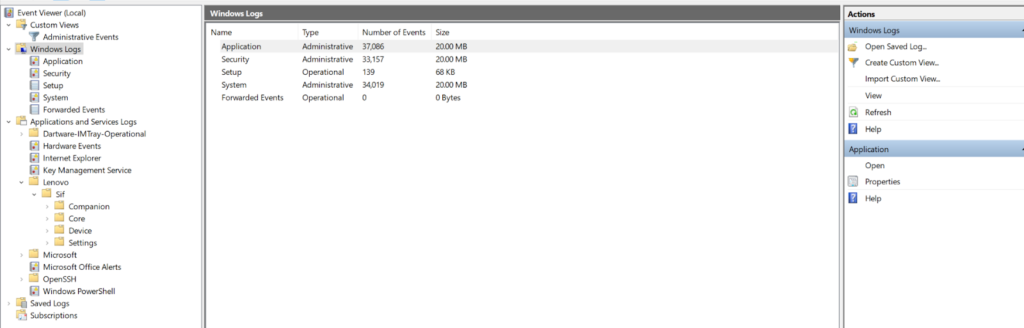
The Windows logs in Event Viewer are:
- Application logs, which include events from different applications on the system. Individual application developers decide which events to record in this log.
- System log events, which are created by system components such as drivers.
- Security logs, which include events related to security activities such as login attempts and creating/deleting/updating files and objects.
- Setup logs, which include activities related to system installation.
- Forwarded Events logs, which are logs forwarded from other Windows machines.
- PowerShell Logs, logs from the PowerShell subsystem that are often used by malicious actors
In addition to these Windows logs, Event Viewer also includes an Applications and Services Log category. As the name implies, logs in this category come from various apps and services, including PowerShell, OpenSSH, and WMI.
Overview of the severity of Windows event logs
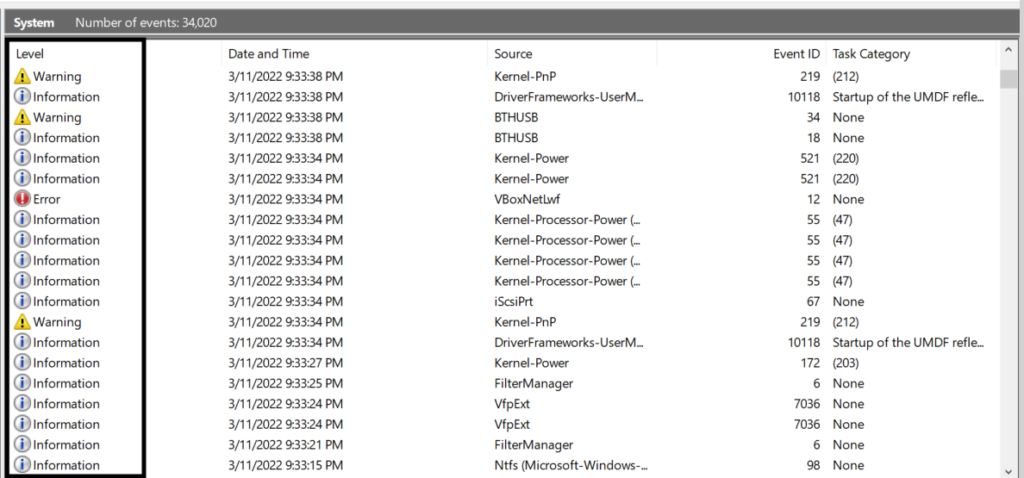
Event Viewer events include a severity level. They also include a Level ID number, with a lower number indicating a higher severity. Application developers can use custom Level IDs to indicate different event severity levels. Below are the default Windows Event severity levels (with Level ID numbers in parentheses):
- Critical (30) events have the highest default severity and include system-wide issues or problems such as an application or service crashing. Critical events often require immediate attention.
- Error (40) events suggest that a problem has occurred but usually do not require immediate attention.
- Warning (50) events indicate a component, application, or service experienced a sub-optimal condition and may have an Error or Critical level issue in the future.
- Information (80) events do not suggest a problem occurred; they inform an administrator of normal progress. Information events are logged with an Informational label in Event Viewer.
- Verbose (100) events are related to progress or success and are more granular than Information events. Like Information events, Verbose events are logged with an Informational label in Event Viewer.
What are Audit Success and Audit Failure?

When you view the Security Log, you may notice that the Details Pane includes a Keyword column and most events have an Audit Success or Audit Failure in that field.
- Audit Success keywords indicate an audited security event completed successfully. For example, a user logged on to a Windows machine.
- Audit Failure keywords indicate an audited security event was initiated but not completed successfully. For example, a failed log-on attempt.
What is the Administrative Events custom view?
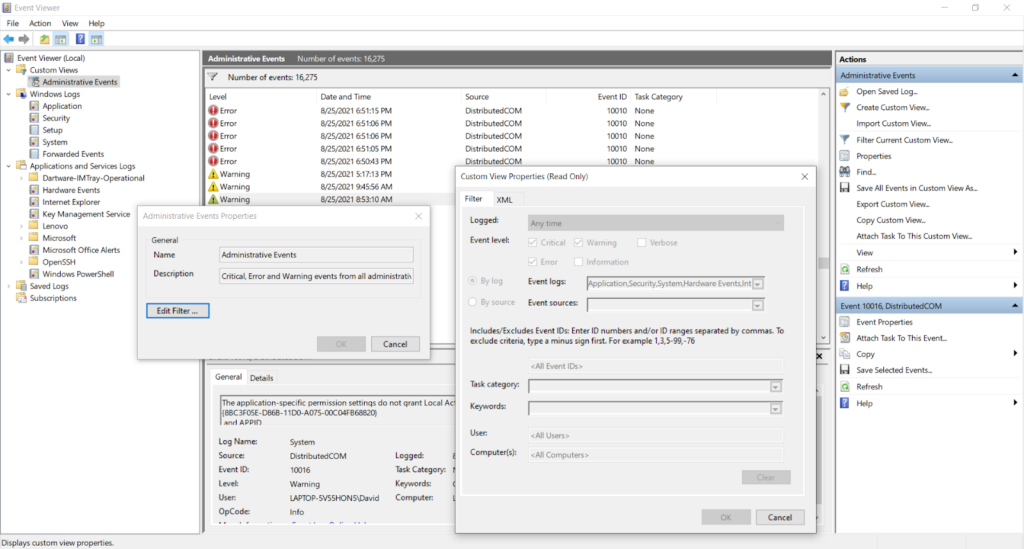
The Administrative Events custom view is available by default on most modern Windows operating systems. It aggregates Critical, Error, and Warning level messages from various “administrative” logs, including the Application, Security, System, and Hardware Events logs. The Administrative Events view can be helpful if you’re looking to troubleshoot a problem using Event Viewer, but you’re not sure where to start.
How to read events in Event Viewer
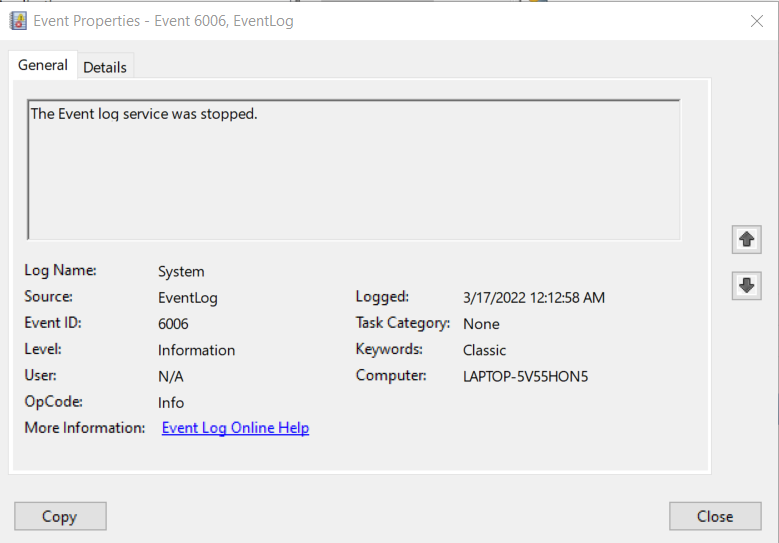
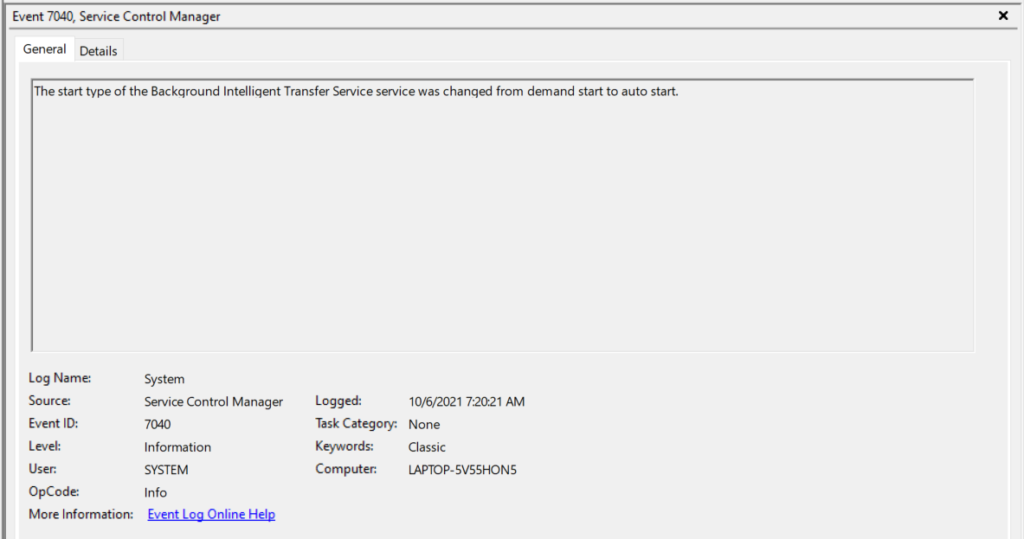
Once you find an event of interest in Event Viewer, you can double-click it to view the event properties in a new window or view the details in the lower half of the Details Pane.
Let’s take a closer look at each of the fields on the General tab of an Event Viewer message. Messages will include a description that summarizes the event, such as The Event log service was stopped. Additionally, you will see these fields:
- Log Name is the log file where the event is stored.
- Source the name of the application, service, or component that triggered the event.
- Event ID is a numeric value that makes filtering event logs—and troubleshooting issues—easier. Once you know what Event IDs to look for, debugging becomes easier. For example, Event ID 6006 in the Windows System log is often an indicator of graceful operating system shutdown. There is also a variety of security-related Event IDs that can indicate when malicious activity has occurred.
- Level is the severity of the event.
- User indicates the user account, if any, associated with the event.
- OpCode is rarely beneficial but can potentially provide more detail on what exactly the Source application, service, or component triggering the message was doing.
- More Information provides a hyperlink that will let you populate the log message data into an online help request.
- Logged is a timestamp for the event.
- Task Category may provide more granular detail to help categorize an event.
- Keywords may contain information to help search for—or further categorize—an event.
- Computer is the name of the Windows computer where the event originated.
Two different views provide additional event data on the Details tab of an event.
1. Friendly View formats the data in a more human-readable format.
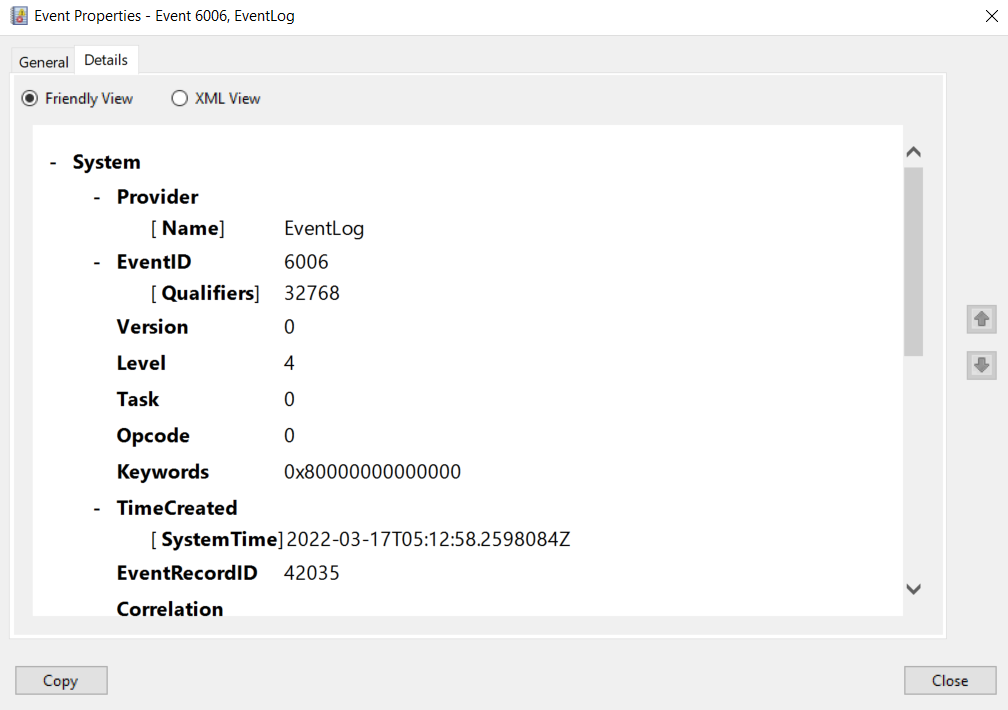 2. XML View formats the data using eXtensible Markup Language (XML)
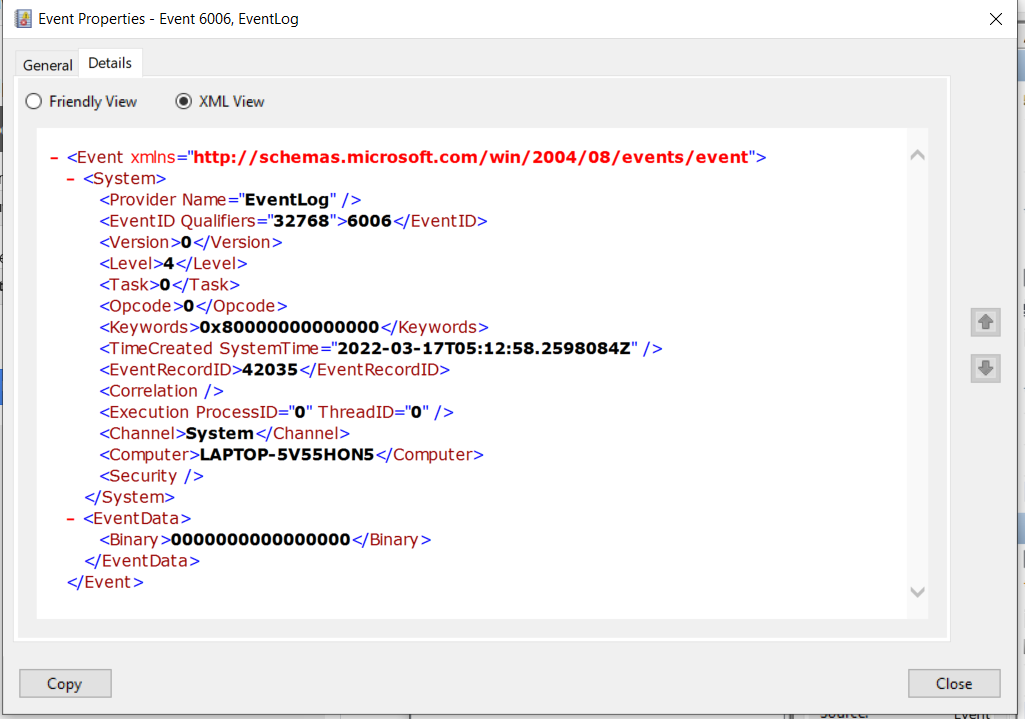
What’s next?
Now that you know the basics of Windows logging, you’re ready to explore more advanced concepts. In Part Two, we will cover topics that include:
- Creating Custom Views in Windows Event viewer
- Using PowerShell to get local and remote event logs
- Important Windows Event IDs to monitor
- How to use task scheduler to automate actions based on Windows events
- How to centralize Windows logs
Log your data with CrowdStrike Falcon Next-Gen SIEM
Elevate your cybersecurity with the CrowdStrike Falcon® platform, the premier AI-native platform for SIEM and log management. Experience security logging at a petabyte scale, choosing between cloud-native or self-hosted deployment options. Log your data with a powerful, index-free architecture, without bottlenecks, allowing threat hunting with over 1 PB of data ingestion per day. Ensure real-time search capabilities to outpace adversaries, achieving sub-second latency for complex queries. Benefit from 360-degree visibility, consolidating data to break down silos and enabling security, IT, and DevOps teams to hunt threats, monitor performance, and ensure compliance seamlessly across 3 billion events in less than 1 second.
Arfan Sharif is a product marketing lead for the Observability portfolio at CrowdStrike. He has over 15 years experience driving Log Management, ITOps, Observability, Security and CX solutions for companies such as Splunk, Genesys and Quest Software. Arfan graduated in Computer Science at Bucks and Chilterns University and has a career spanning across Product Marketing and Sales Engineering.