In our first two Windows Logging guides, we explored basic and advanced concepts for general Windows logging. In this article, we will hone in on logs for two of the most common Windows Server applications:
- Microsoft SQL Server—Microsoft’s relational database management system (RDBMS).
- Internet Information Services (IIS)—Microsoft’s popular Windows web server application.
Both of these apps are staples in Windows ecosystems. Understanding how their logs work can make you a more efficient administrator. Let’s start with Microsoft SQL Server.
Learn More
- Part 1: The Basics
- Part 2: Advanced Concepts
- Part 3: Logging With IIS and SQL Servers
- Part 4: Centralizing Logs
Microsoft SQL Server logs
Microsoft’s popular RDBMS creates multiple logs and provides administrators with several ways to access those logs. We’ll focus on using SQL Server Management Studio (SSMS) to access and interact with key SQL Server logs.
SQL Server Transaction Log
The transaction log sequentially records the modifications and transactions that occur on a SQL Server instance. This log is a crucial part of database transaction recovery, database restoration, high availability, and disaster recovery for SQL Server.
The transaction log consists of smaller virtual log files (VLFs) in a larger, logical log file. It uses a circular approach in which VLFs are eventually overwritten. To understand how this circular process works, it’s important to become familiar with the following concepts:
- Log Sequence Number (LSN)—The LSN is a unique number that identifies a record in the transaction log. An individual LSN record contains granular information on transactions, such as the
Log Record Length,Previous LSN,Page ID, andOperation. - MinLSN—The oldest LSN required for a complete database recovery.
- Truncation—The transaction log truncation process removes unnecessary VLFs to free space in the logical file. Depending on the SQL Server’s recovery model, truncation may occur after a checkpoint or backup.
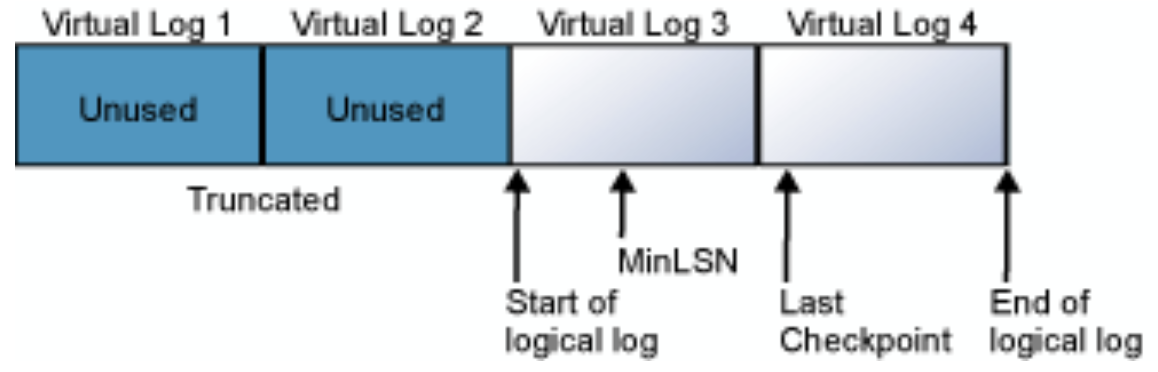 The SQL Server transaction log with truncated and untruncated VLFs and the MinLSN visualized. ( Source ).
Now, back to that circular process. As transactions occur, they are recorded in the VLFs with a unique LSN. After backups or checkpoints, unneeded log files are truncated. The transaction log continues to append to the VLFs until it reaches the end of the logical log, then it repeats with the first VLF. If truncation occurs normally and the MinLSN remains untruncated, the transaction log can successfully support full database recoveries without the file growing too large or impacting performance.
SQL Server Transaction Log Location
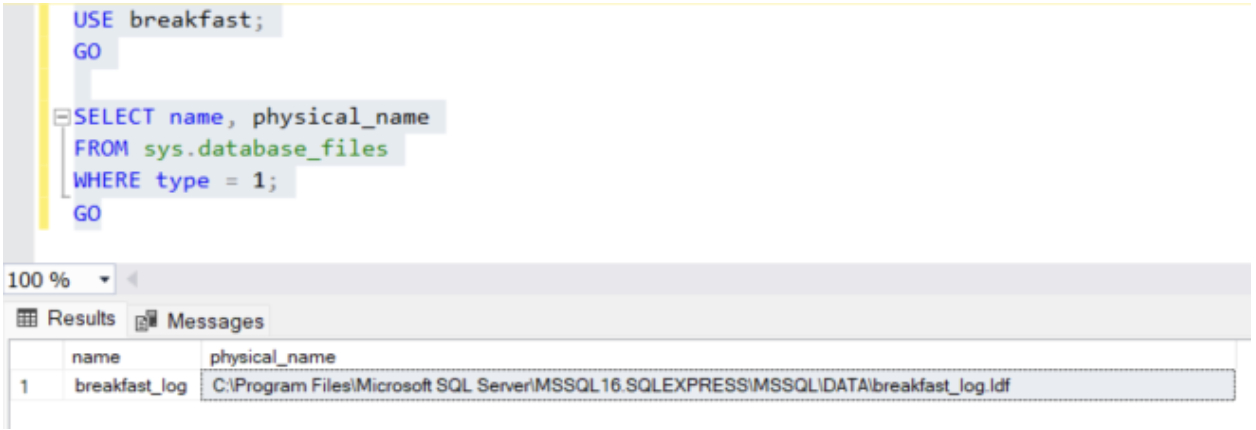
By default, transaction logs are located in the same directory as the data files for a database (such as C:Program FilesMicrosoft SQL ServerMSSQL16.SQLEXPRESSMSSQLDATA on modern Windows operating systems) and use the .ldf (log database file) format and file extension. You can check the location of the transaction log with this command:
USE database_name;GO
SELECT name, physical_name
FROM sys.database_files
WHERE type = 1;
GO
How To Read SQL Server Transaction Log Files
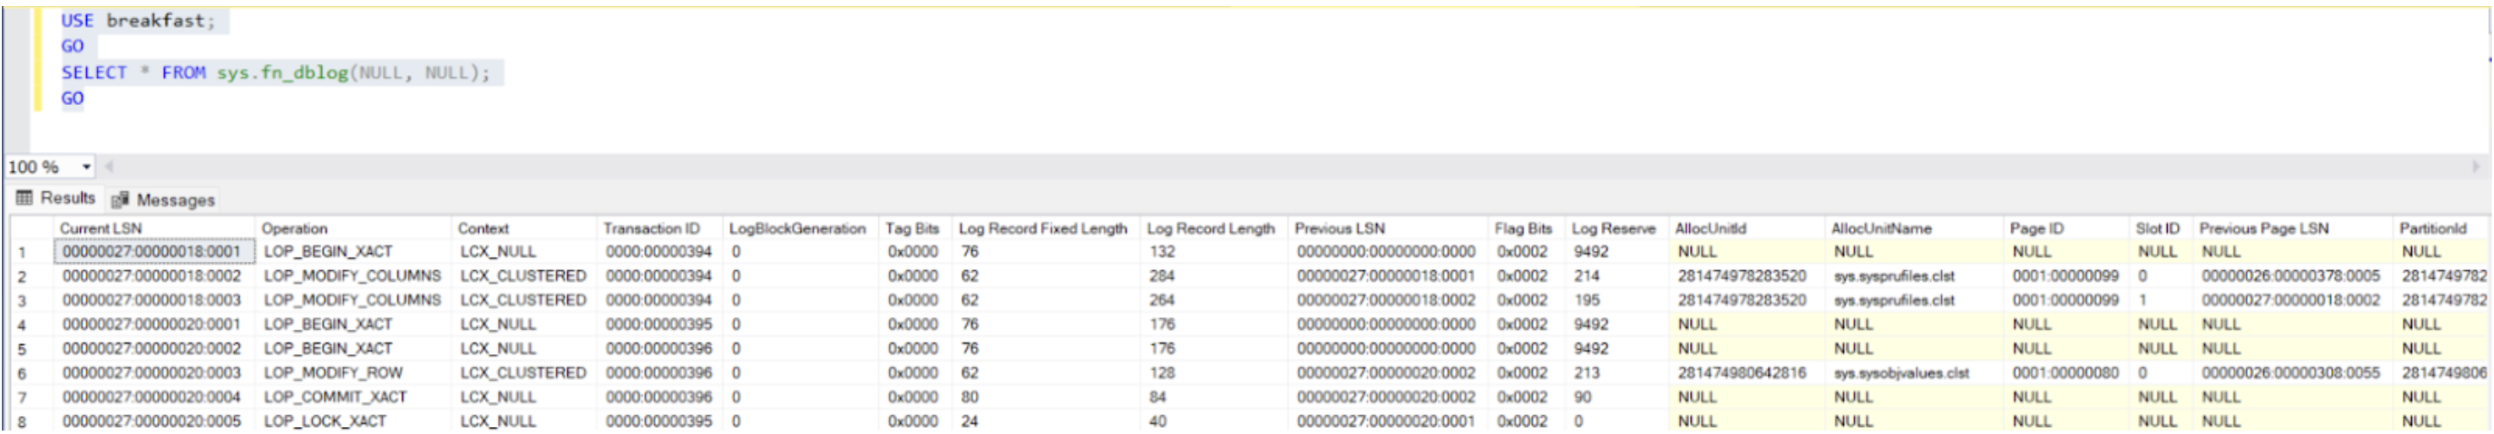
To read .ldf files, you can use third-party tools (sometimes called “SQL transaction readers” or similar) or the unofficial (but popular) fn_dblog command. For example, to read all the transaction log entries for database_name, you can use this command:
USE database_name;GO
SELECT * FROM sys.fn_dblog(NULL, NULL);
GO
SQL Server Error Log
The SQL Server error log is simpler than the transaction log. As an administrator, you’ll more likely need to read and analyze the error log than the transaction log for troubleshooting. If the system isn’t working properly and you’re looking for clues, this log is a good place to start.
SQL Server Error Log Location
By default, the SQL Server error log is located at %ProgramFiles%Microsoft SQL ServerSQL_versionMSSQLLog.
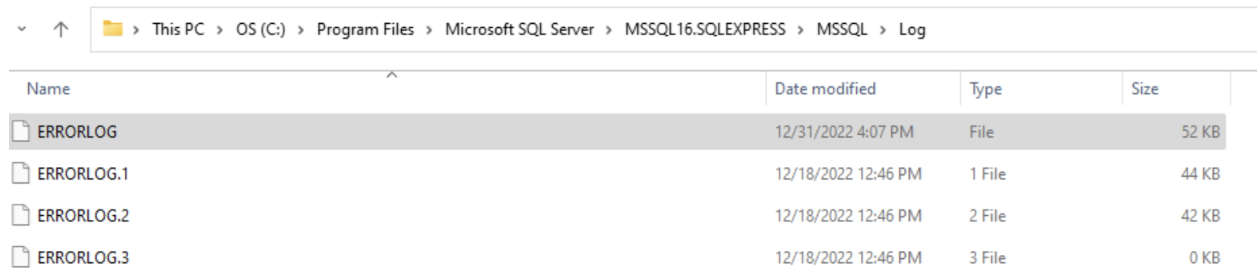
A new plaintext ERRORLOG file is created when the SQL Server service starts. Older logs have a number appended to them, and a higher number implies an older log (for example, ERRORLOG.2 is older than ERRORLOG.1).
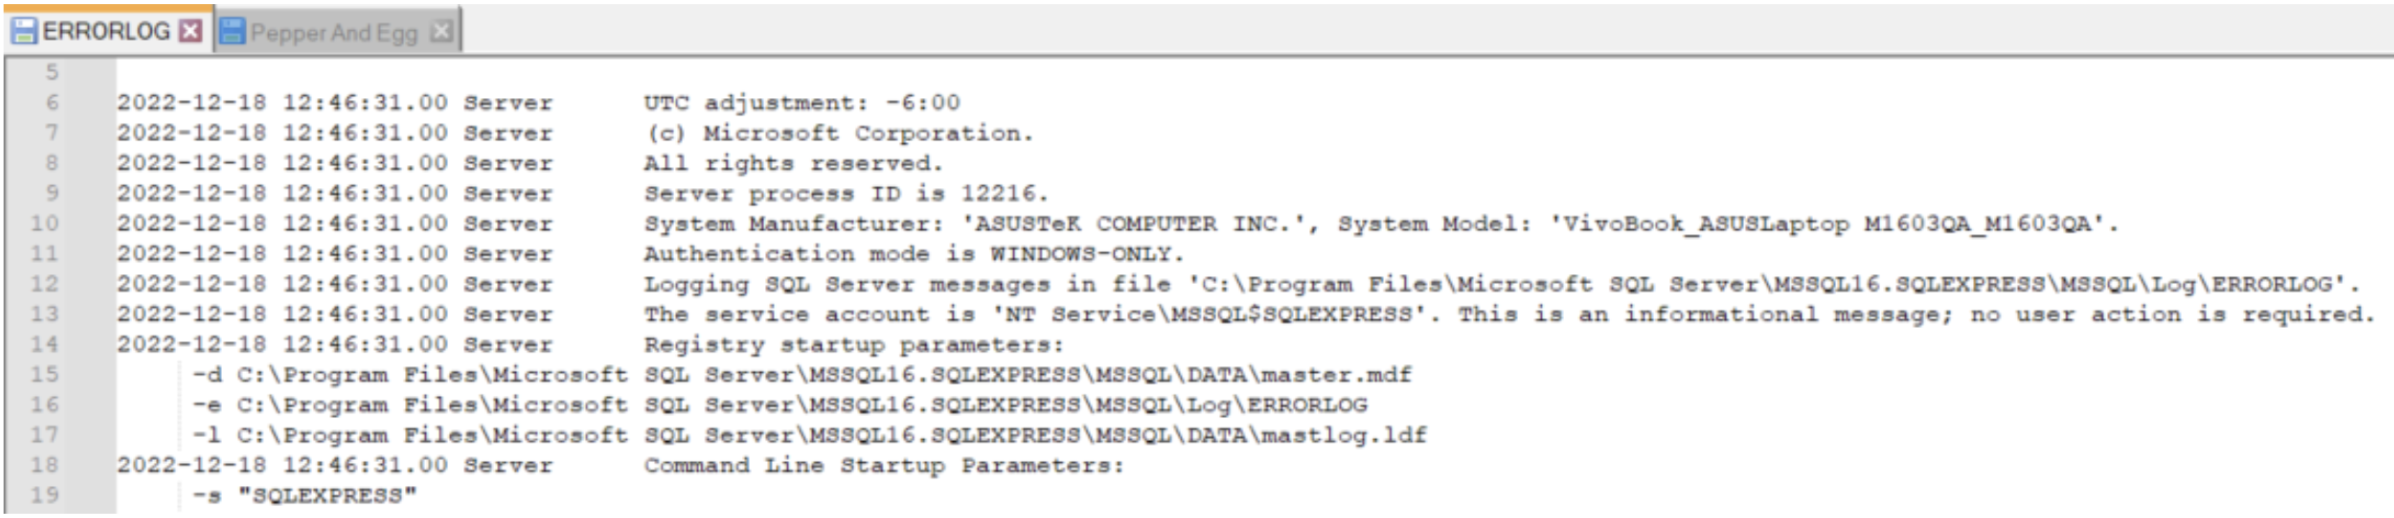
How To Read the SQL Server Error Log
Because the SQL Server error log is a plaintext file, you can read it with a text editor like Notepad or Notepad++.
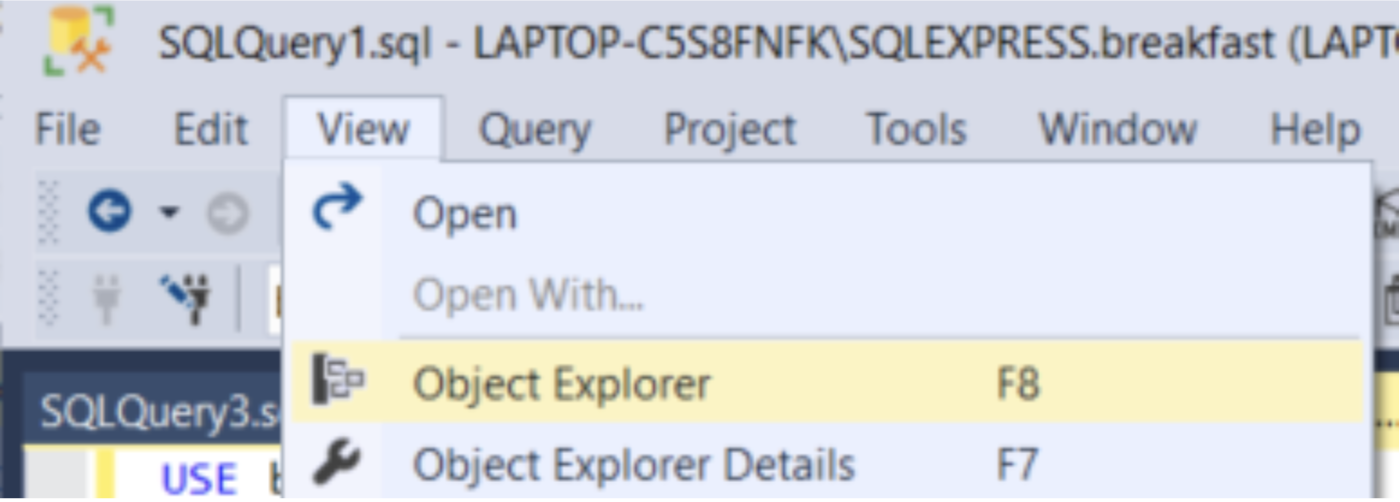
You can also use SSMS to view the log to better visualize and filter the data. To use SSMS to view the error log, follow these steps:
1. Launch Object Explorer with the F8 key or click View → Object Explorer.
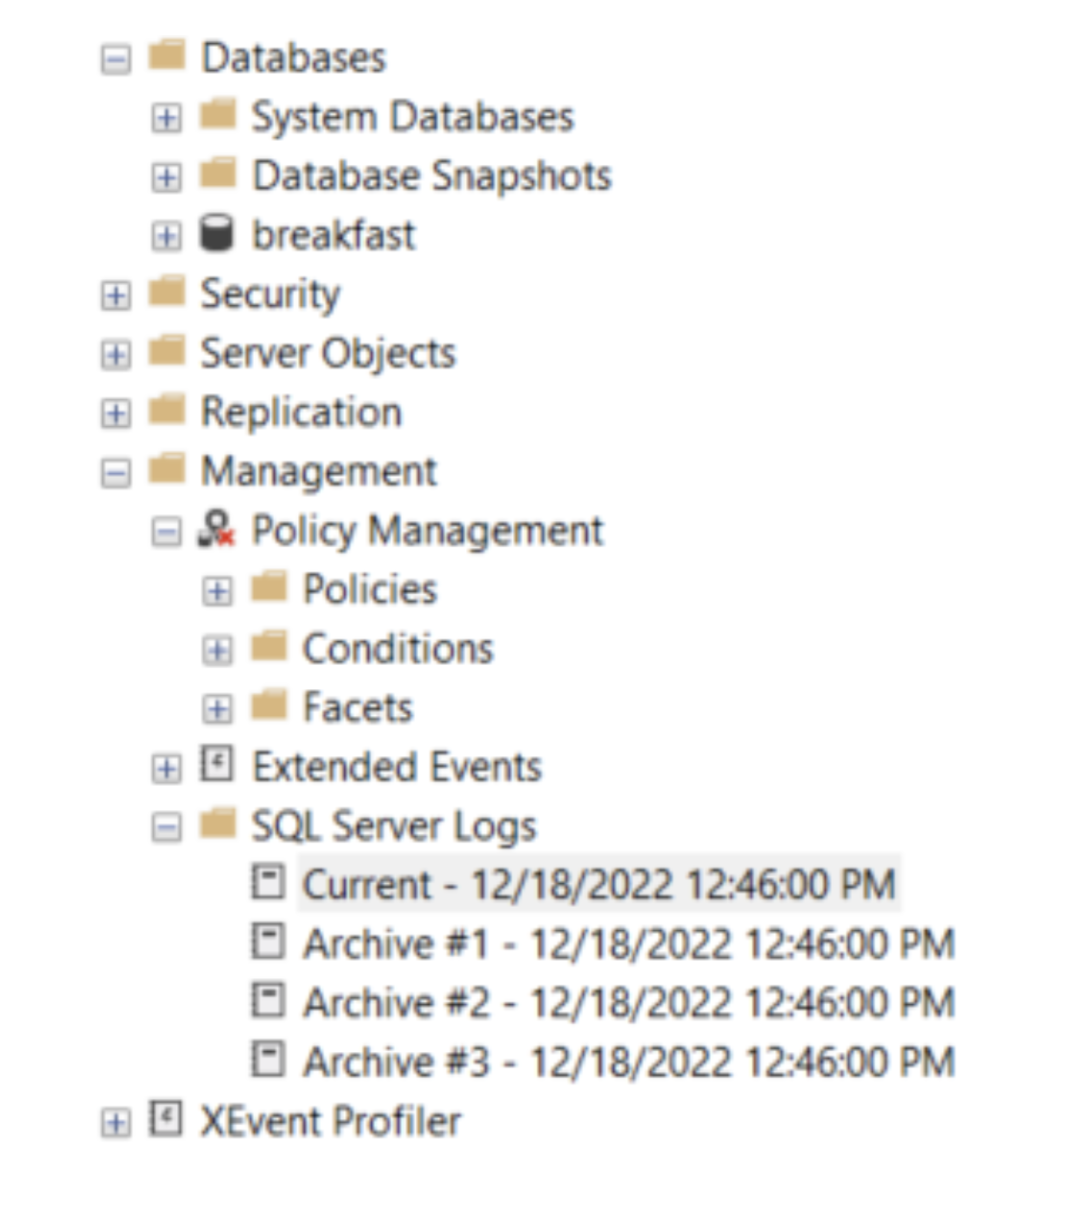
2. Expand the Management folder.
3. Expand the SQL Server Logs folder.
4. Double-click the desired log. The current log includes the word “Current” at the beginning of the name by default.
5. Now you can view, filter, and export the log data.
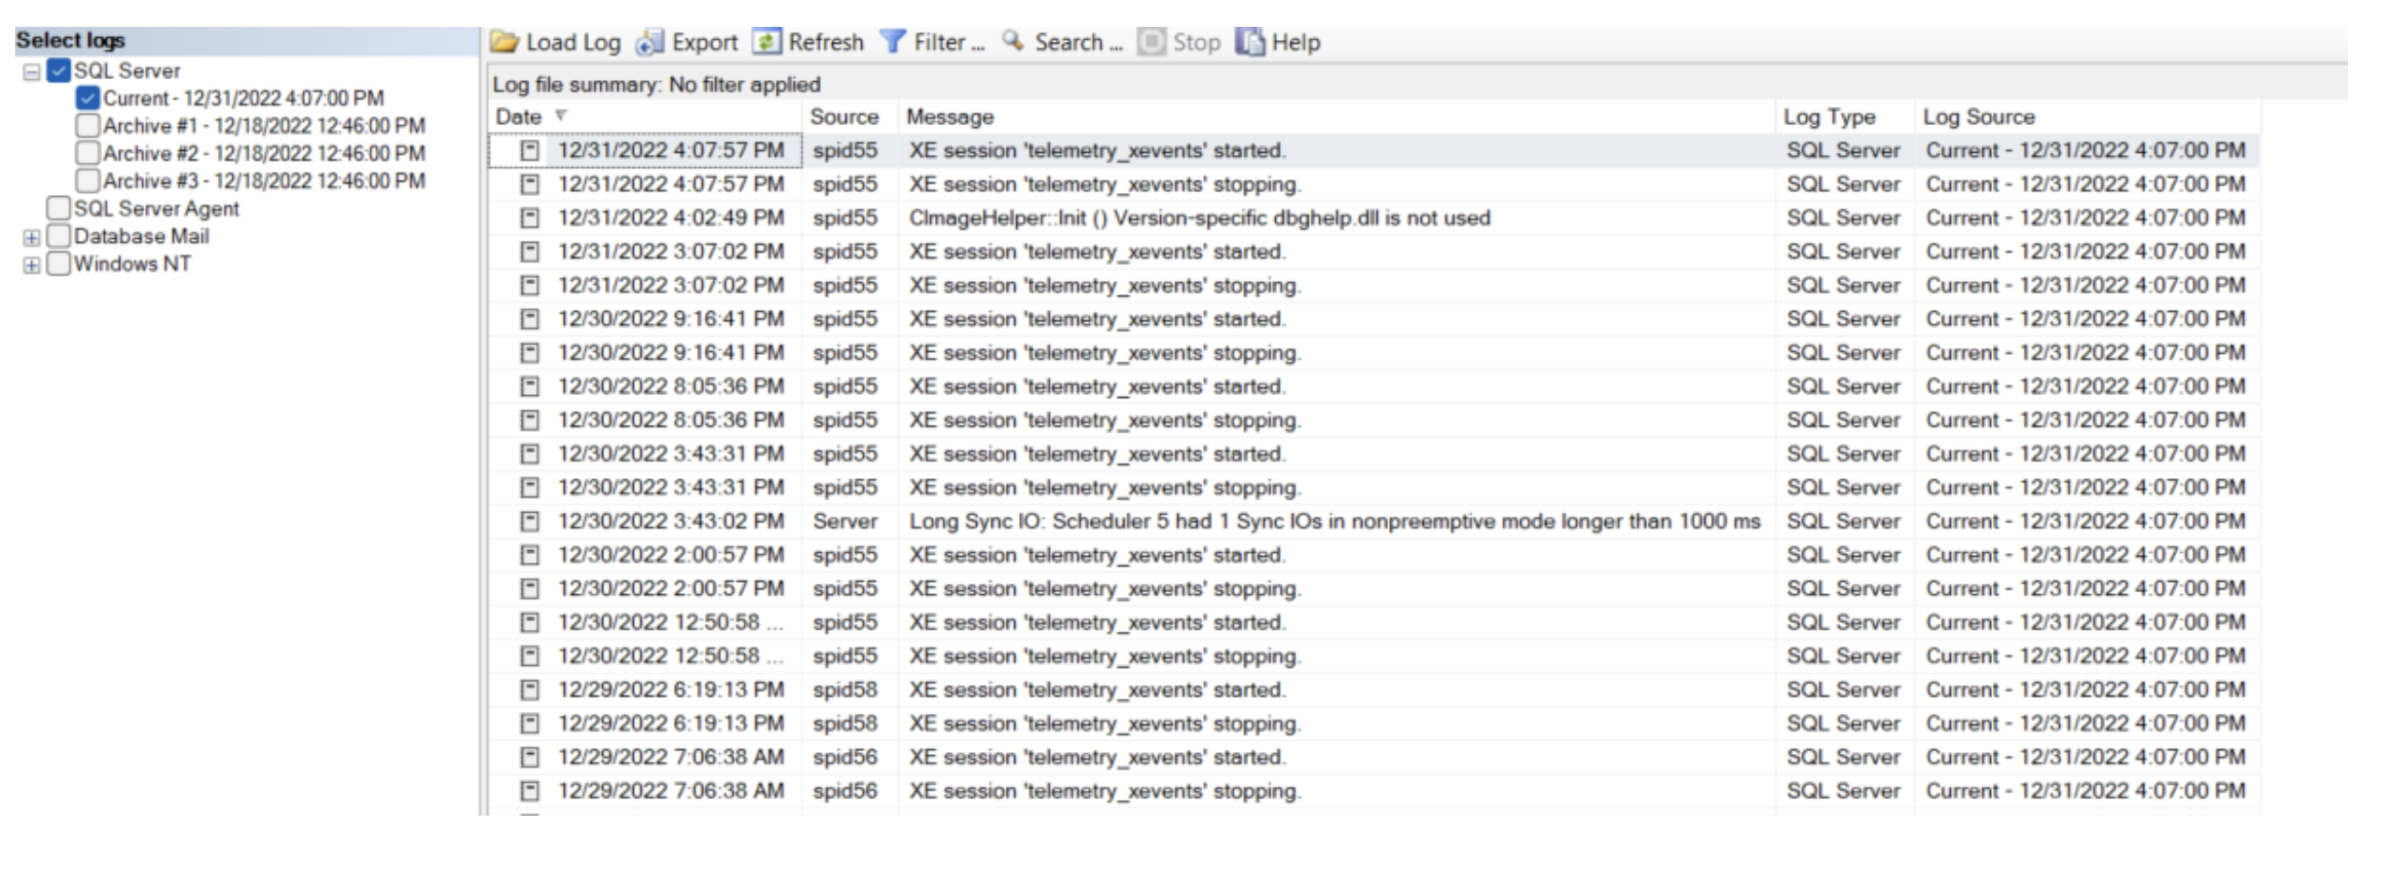
The fields in the error log are:
- Date—A date and timestamp for the log record
- Source—The source of a log message. This is often a specific SPID or the server itself.
- Message—The log message content.
- Type—The type of log. For basic configurations, this will usually be
SQL Server. - Log Source—Which log file contains the record. This field is useful if you view multiple logs at once in SSMS.
Tips for Managing SQL Server Log Size
Both performance and logs are important aspects of maintaining a SQL Server. Unfortunately, logs can impede server performance at times. Usually, when logs become a problem, it's because they’ve grown too large. However, if the transaction log is too small to keep up with database queries, this can be a problem, too.
Striking a balance between log storage and performance can help you get the most out of your SQL Server deployment.
Here are some tips for managing SQL Server log size to help you get it right:
Expert Tip
Note that manipulating transaction log file size is a complex topic. For a deeper dive into managing transaction log growth, see Microsoft’s Manage the size of the transaction log file article.
- Don’t set the transaction log
FILEGROWTHparameter above 1,024 MB. Beginning with SQL Server 2016, the defaultFILEGROWTHparameter for the transaction log is 64 MB. Microsoft recommends against changing the parameter above 1,024 MB. Additionally, starting in SQL Server 2022 (16.x) instant file initialization (IFI) can benefit transaction log autogrowth events of up to 64 MB. - Use the
DBCC SHRINKFILETransact-SQL (T-SQL) command to reduce VLF space. TheDBCC SHRINKFILEcommand'sTRUNCATEONLYparameter can remove inactive VLFs to free up space on your system. - Set reasonable max error log sizes. A cap on the size and quantity of SQL Server error logs can help you save space on your system. To set a max file size and number of error logs in SCCM, follow these steps:
1. Launch Object Explorer with the F8 key or click View → Object Explorer.
2. Expand the Management folder.
3. Right-click the SQL Server Logs folder and click Configure.
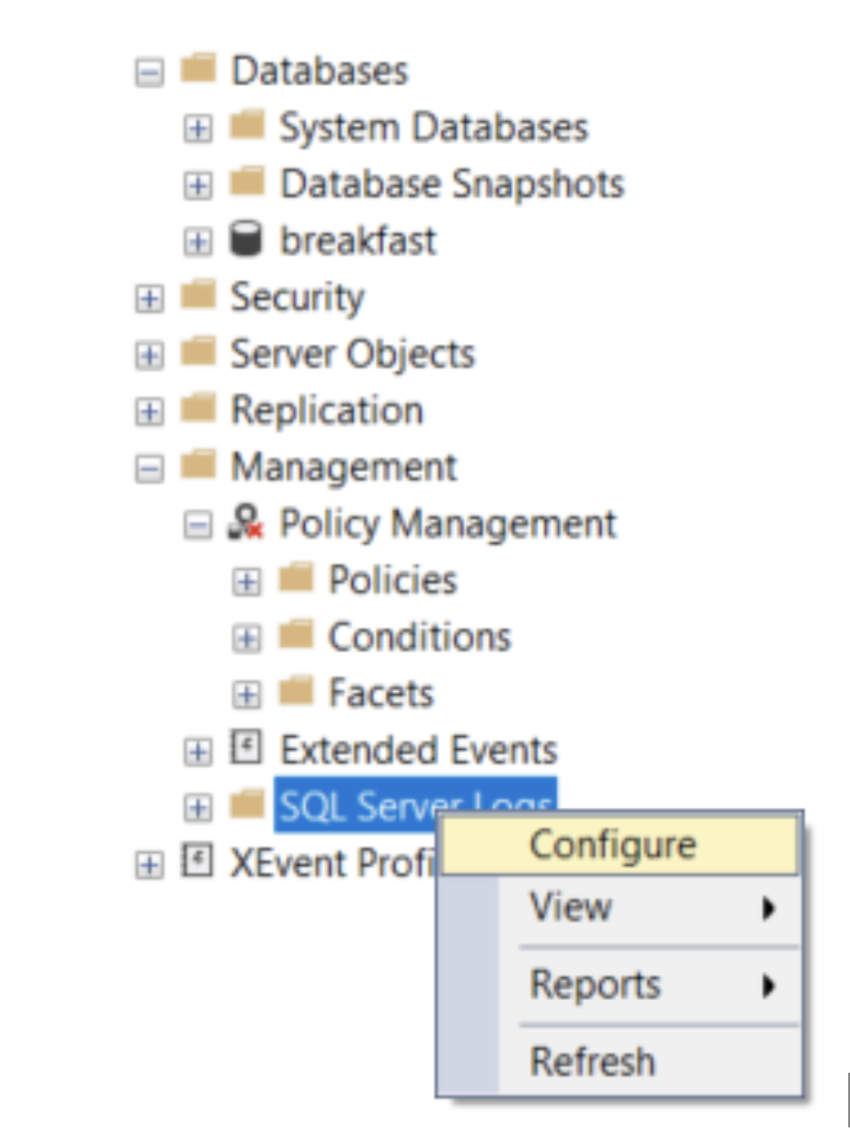
4. Input values for the maximum number of error log files and the maximum size of an error log file (in KB), then click OK.
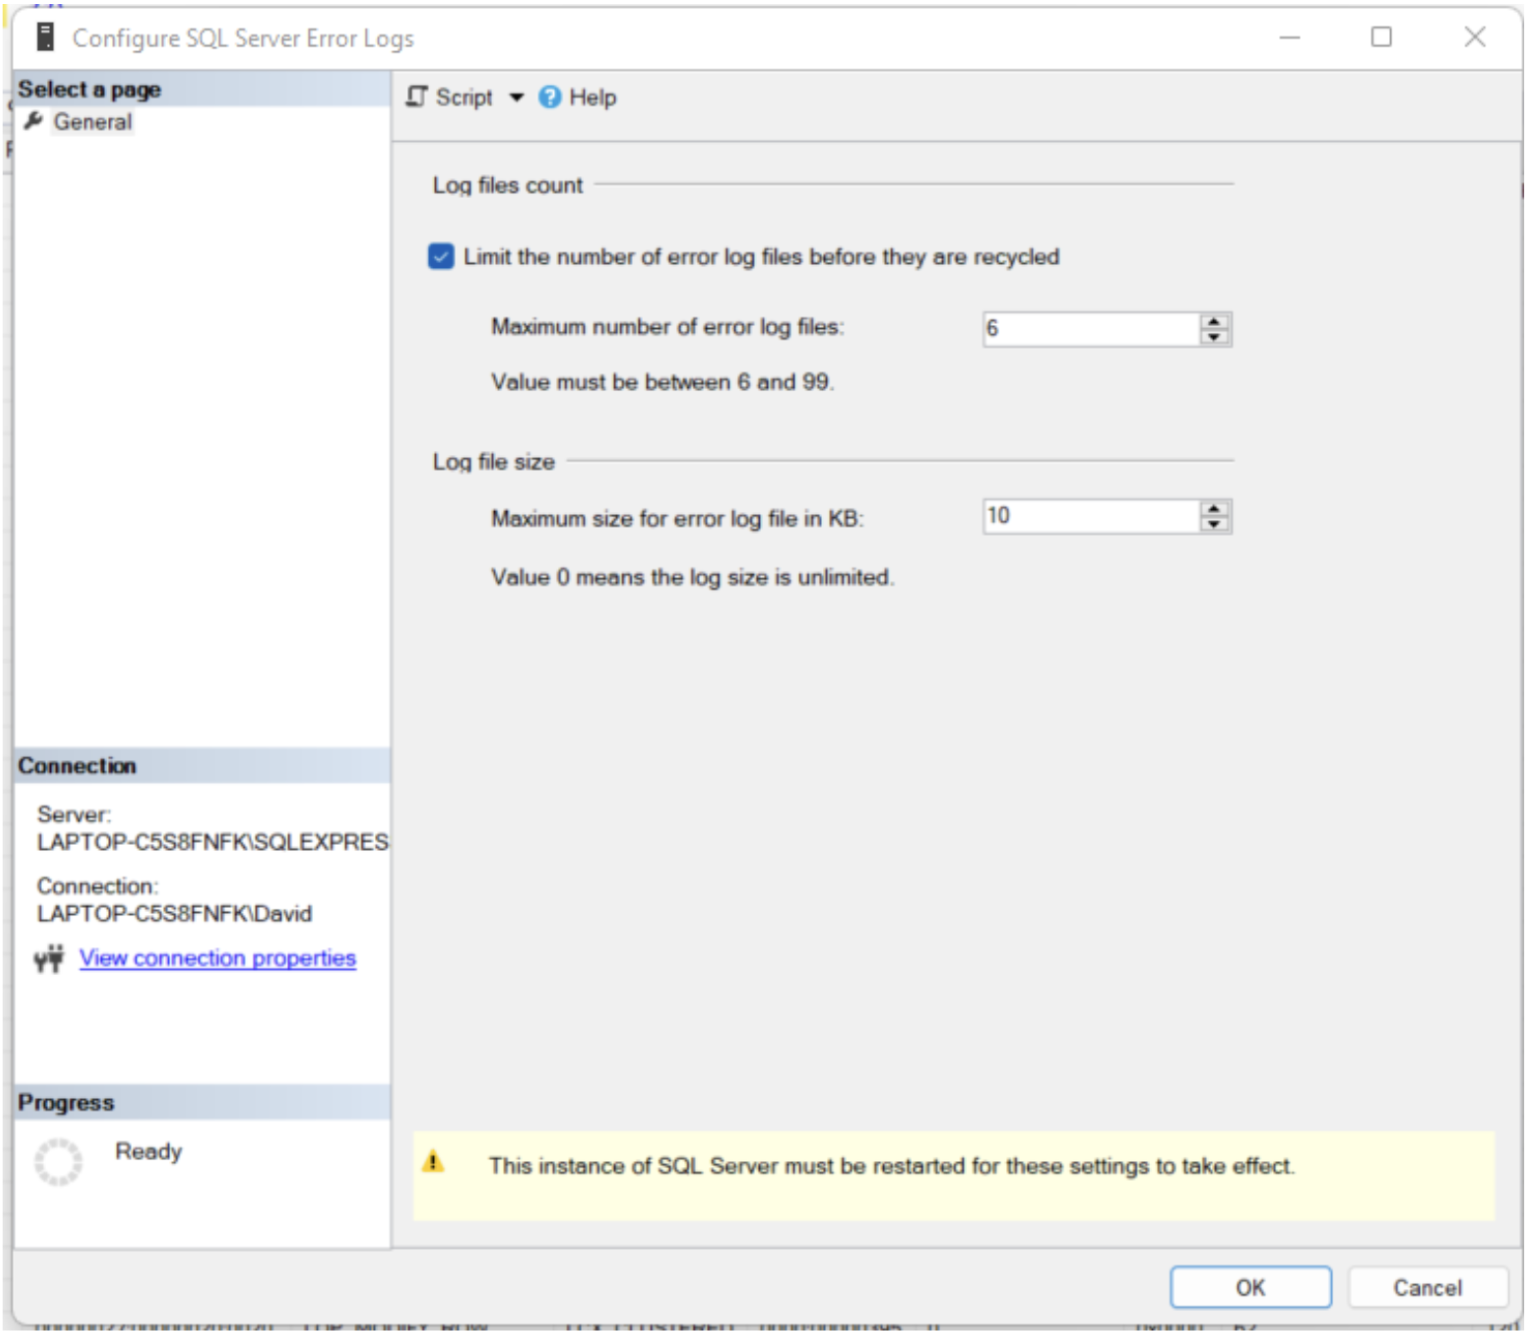
5. The changes will take effect the next time your SQL Server instance restarts.
IIS Server Logs
In the *nix world, nginx and Apache are two of the most popular web server applications. In Windows environments, IIS is often the go-to web server application. IIS records logs that are comparable to nginx and Apache’s error and access logs. In this section, we’ll look at important IIS logs and how you can modify them.
We’ll use the IIS Manager in some of our examples below. We recommend installing it if you want to follow along.
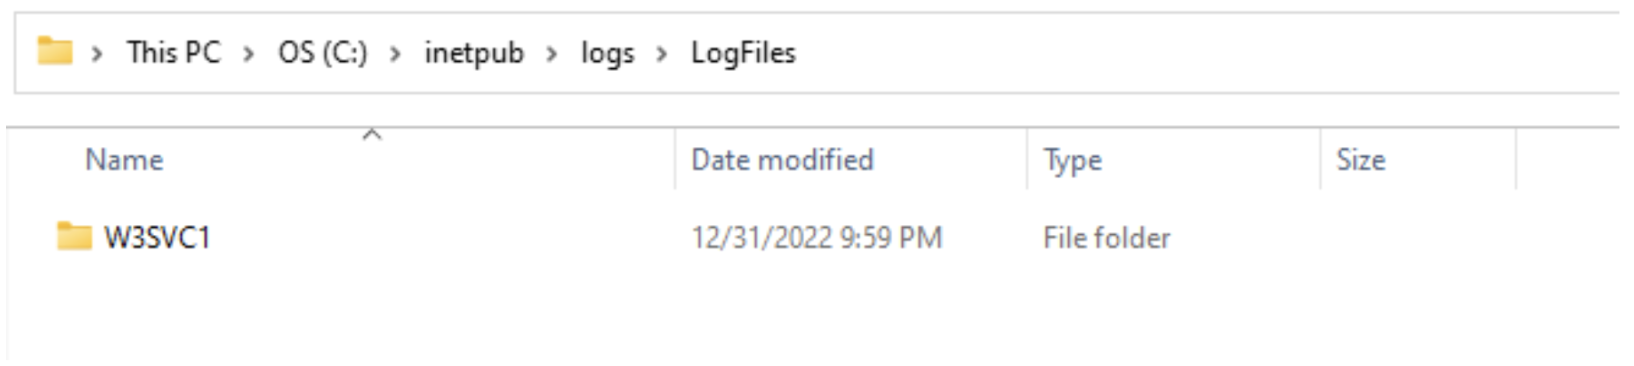
Where To Find IIS Server Logs
Nginx and Apache logs are generally in subdirectories of /var/log/ by default. For IIS, the default location is %SystemDrive%inetpublogsLogFiles. For most systems, that means the files will be in subdirectories at C:inetpublogsLogFiles, and each of your sites will have a folder in that subdirectory.
How To Read IIS Server Logs
IIS log files are plaintext files that you can read with a text editor like Notepad or Notepad++.
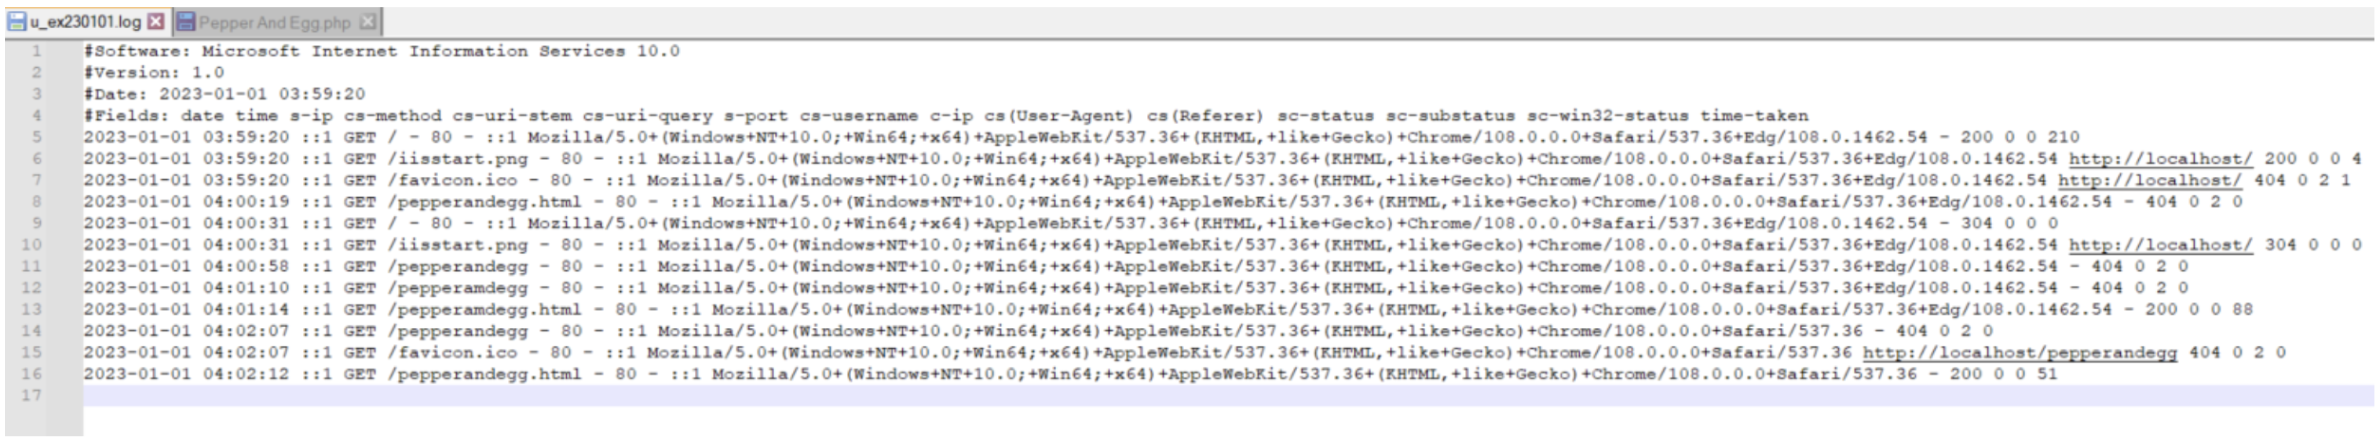
The default fields in an IIS server log are described in the table below.
IIS Server Log Fields
| Field | Description | Example Value |
|---|---|---|
| date | The date the log record was created. | 2023-11-11 |
| time | The time the log record was created in HH:MM:SS format. | 11:11:59 |
| s-ip | The “server IP” where the log record was created. | 198.51.100.11 |
| cs-method | The type of request (for example, the associated HTTP verb). | GET |
| cs-uri-stem | The URI the client requested. | /recipes/breakfast/pepperandegg.html |
| cs-uri-query | The query associated with the request (only relevant for dynamic pages). | param1=egg¶m2=giardiniera |
| s-port | The server port that the request was made on. | 80 |
| cs-username | Username associated with an authenticated request or a - character if the request is unauthenticated. | webuser123 |
| c-ip | The “client IP” of the client making the request. | 192.0.2.11 |
| cs(User-Agent) | The client’s user agent. | Mozilla/5.0+(Windows+NT+10.0;+Win64;+x64)+AppleWebKit/537.36+(KHTML,+like+Gecko)+Chrome/108.0.0.0+Safari/537.36+Edg/108.0.1462.54 |
| cs(Referer) | The site that referred the user or a - if no relevant data available. | http://www.example.com/bestbreakfast.html |
| sc-status | The HTTP status code associated with the request. | 200 |
| sc-substatus | The <a href="https://learn.microsoft.com/en-us/troubleshoot/developer/webapps/iis/www-administration-management/http-status-code#http-substatus-codes-added-in-iis-80">substatus code</a> associated with the request. | 0 |
| sc-win32-status | The <a href="https://learn.microsoft.com/en-us/windows/win32/debug/system-error-codes">Windows status code</a> associated with the request. | 0 |
| time-taken | How long the request took in milliseconds. | 210 |
How To Change IIS Log File Settings
The default fields in the IIS logs are not your only options. You can customize IIS logs to meet specific requirements. You can use the IIS manager to modify IIS log settings by following these steps:
1. Launch IIS Manager.
2. Select Sites → <Your Website>.
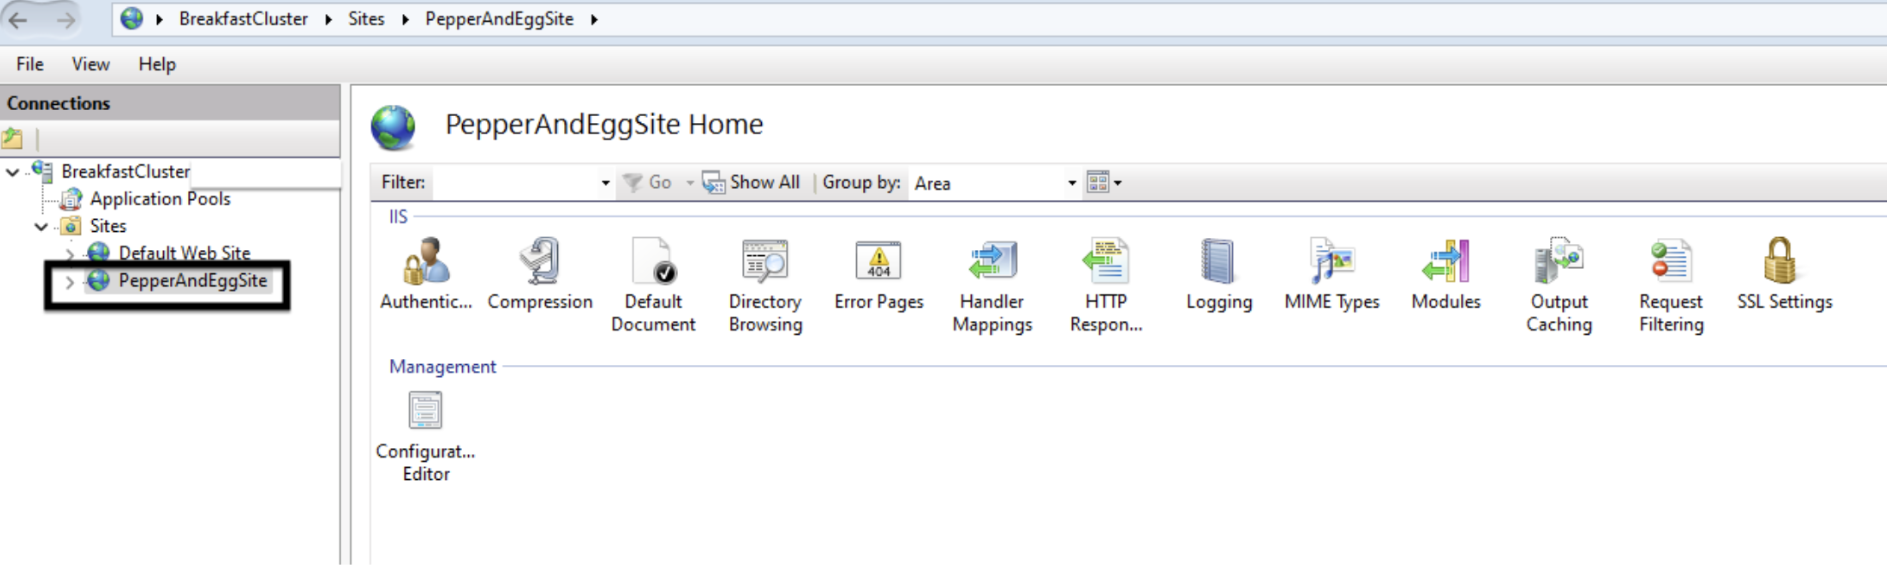
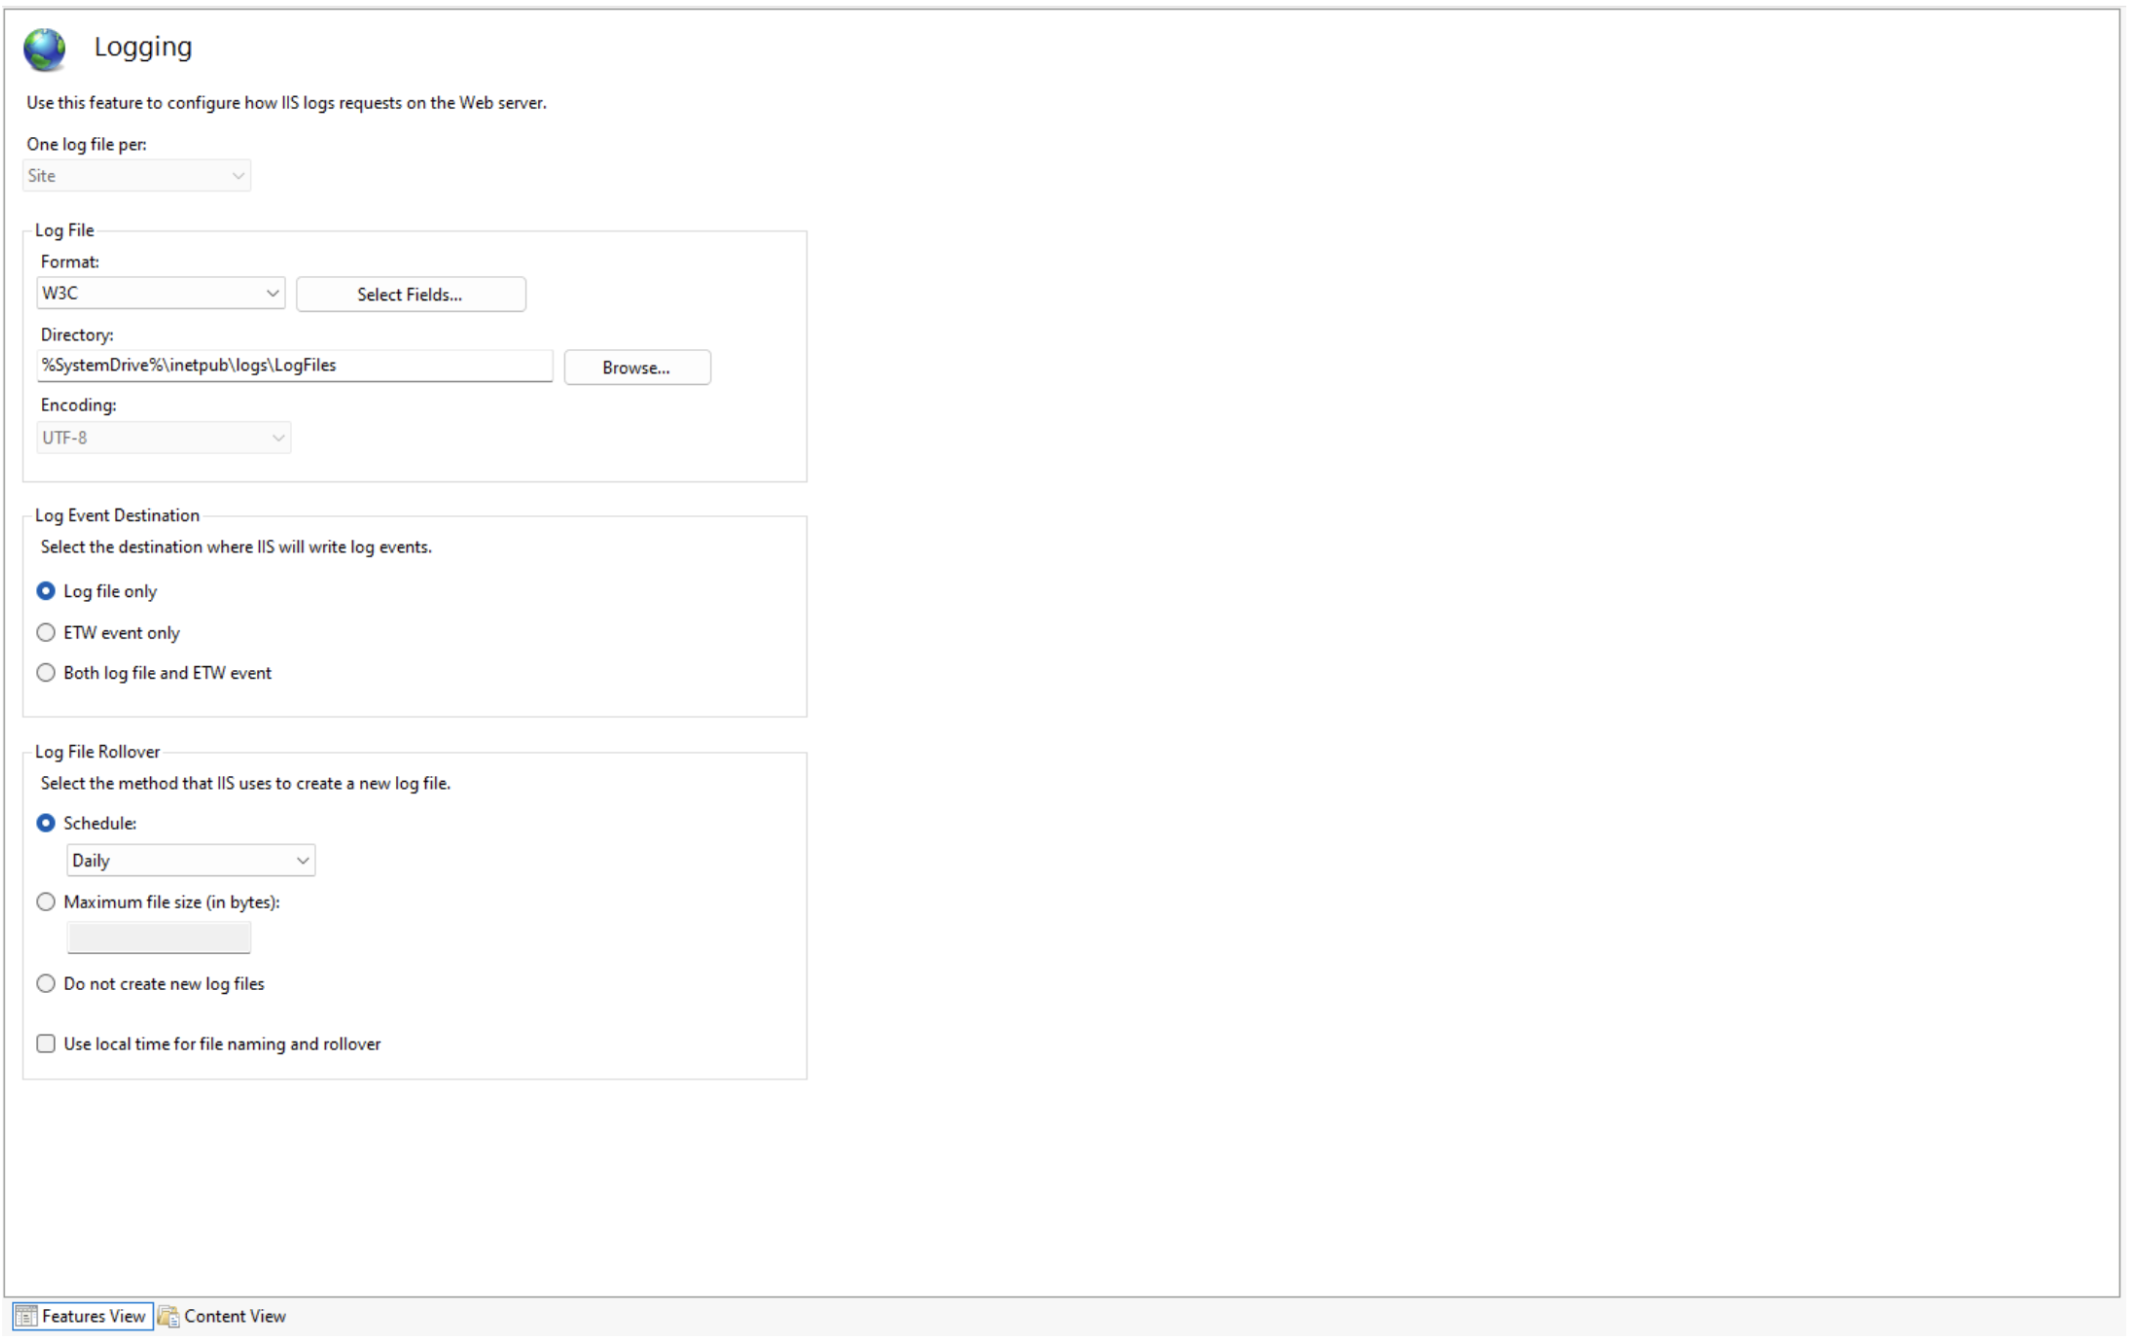
3. Double-click the Logging icon.
4. Make and apply your changes.
We’ll review the different modifications you can make in the sections below.
IIS Log File Settings
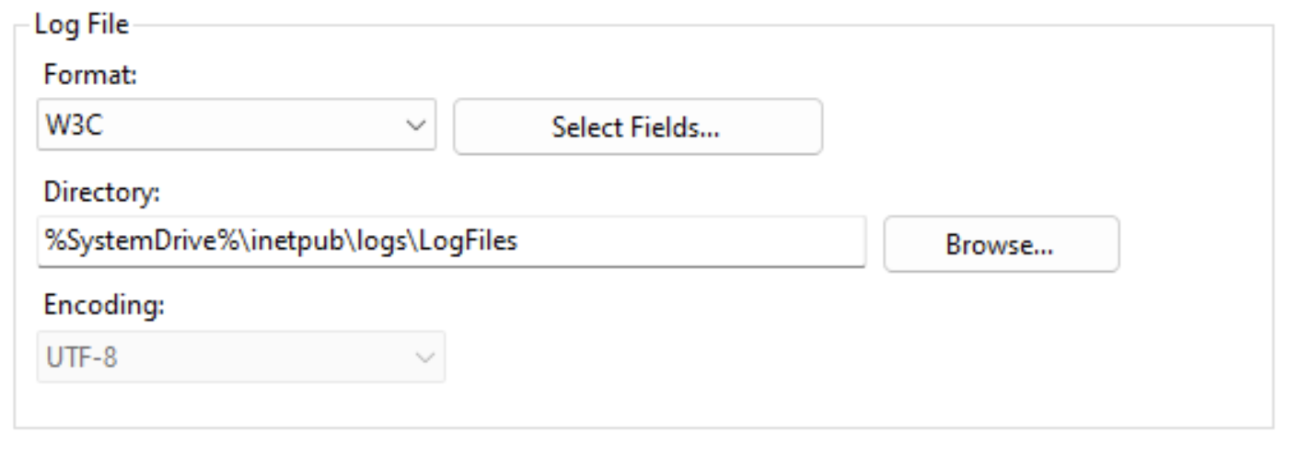
- Format—W3C logging is the default formatting. You can modify the fields in the W3C format using the Select Fields button. You can change the format to IIS or NCSA, both of which are fixed formats (which means you cannot modify fields). If W3C, IIS, or NCSA formats don’t meet your needs, consider Custom Logging for older IIS versions or Enhanced Logging for newer IIS versions.
- Directory—The directory to store your IIS log files. In addition to specifying a local directory, you can send the logs to a remote server using UNC paths (for example,
\RemoteServerLogDir). - Encoding—The encoding used for IIS log files.
IIS Log Event Destination
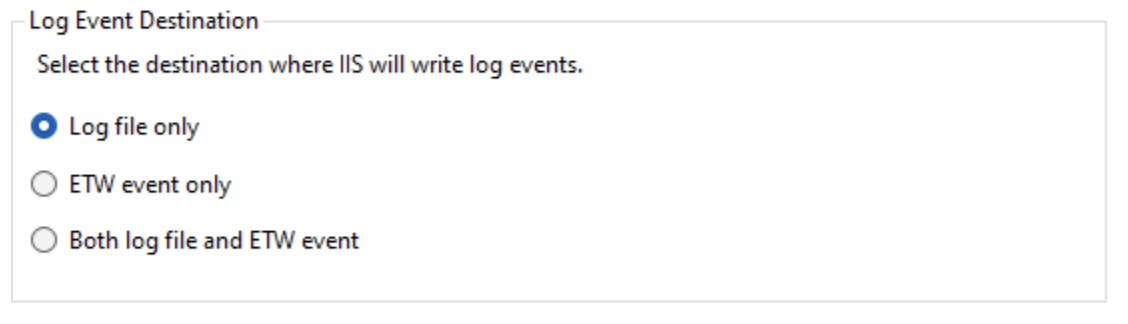
In addition to the IIS log file, newer versions of IIS support Event Tracing for Windows (ETW). This section allows you to configure IIS to write to its log files only, ETW only, or both.
IIS Log File Rollover
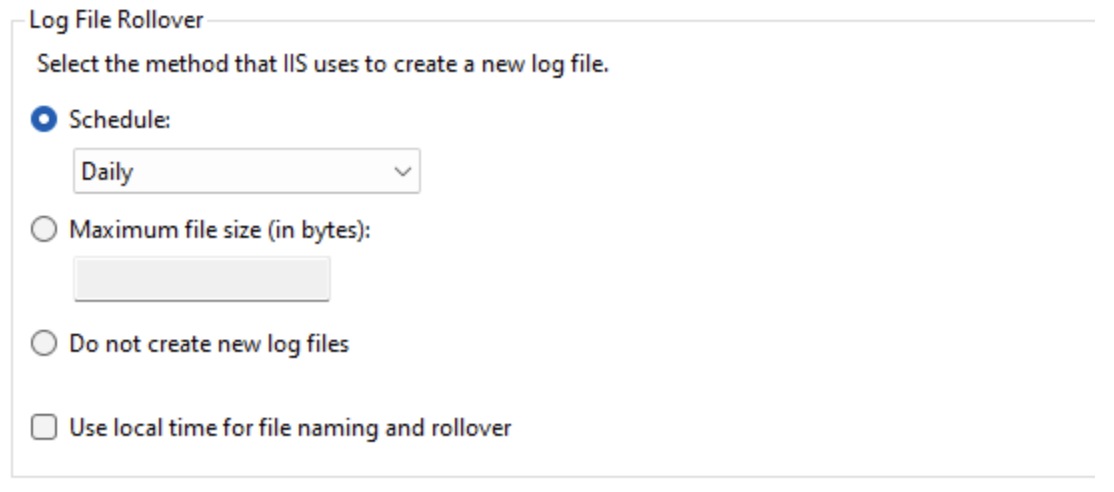
The IIS Log File Rollover settings define how IIS handles log rollover. You can schedule the log files to roll over at a given time interval (Hourly, Daily, Weekly, and Monthly), based on file size, or not create new log files at all. If you want to optimize IIS log file storage, check out Microsoft’s Managing IIS Log File Storage article, which includes scripts for deleting old logs and covers enabling folder compression.
Log your data with CrowdStrike Falcon Next-Gen SIEM
Elevate your cybersecurity with the CrowdStrike Falcon® platform, the premier AI-native platform for SIEM and log management. Experience security logging at a petabyte scale, choosing between cloud-native or self-hosted deployment options. Log your data with a powerful, index-free architecture, without bottlenecks, allowing threat hunting with over 1 PB of data ingestion per day. Ensure real-time search capabilities to outpace adversaries, achieving sub-second latency for complex queries. Benefit from 360-degree visibility, consolidating data to break down silos and enabling security, IT, and DevOps teams to hunt threats, monitor performance, and ensure compliance seamlessly across 3 billion events in less than 1 second.
Arfan Sharif is a product marketing lead for the Observability portfolio at CrowdStrike. He has over 15 years experience driving Log Management, ITOps, Observability, Security and CX solutions for companies such as Splunk, Genesys and Quest Software. Arfan graduated in Computer Science at Bucks and Chilterns University and has a career spanning across Product Marketing and Sales Engineering.