In part one of this series on Heroku logging, we covered the Heroku architecture for collecting logs, the log message format, and how you can use the Heroku CLI to interact with the collected logs.
In part two, we’ll cover the more advanced concepts of Heroku logging, focusing on how you can customize the experience to fit the unique needs of your application. We’ll see how Logplex works within the Heroku application architecture. We’ll cover how to create log drains to customize your log processing and how to use external integrations like Falcon LogScale. Finally, we’ll examine best practices for logging on Heroku.
Learn More
Explore the complete Heroku Logging Guide series:
- Part 1: The Basics
- Part 2: Advanced Concepts
- Part 3: CLI Cheat Sheet and Private Space Logging
- Part 4: Integrating With CrowdStrike Falcon LogScale
Logplex
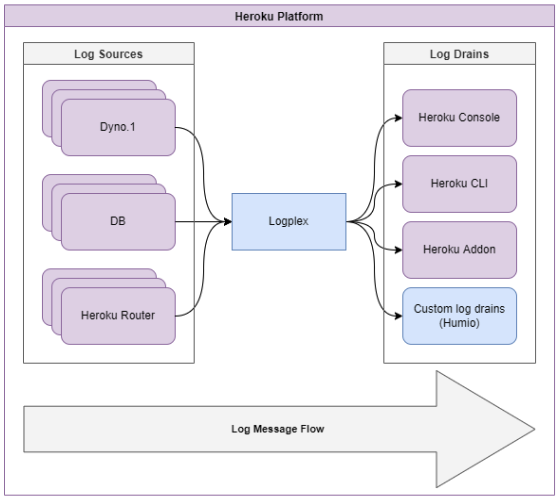
For an application deployed on the Heroku platform, the Logplex router is the component that will collect all the different log sources such as dynos, routing, and add-ons. With this logging architecture, you can configure the logging behavior with custom destinations for log output. What’s more, these configurations can be applied to all or selected log sources.
Logplex works by moving messages from log sources into log drains, which are external services to which Logplex forwards logs. Once Logplex has forwarded a message to the log drain, you can use these messages for processing, auditing, and monitoring based on your requirements. Below is a simple diagram for the flow of messages through Logplex on the Heroku platform.
By default, Logplex only stores the most recent 1,500 log messages received. Logplex is not designed for long-term storage of logs, but for real-time and high-performance delivery. Logplex achieves this by keeping a buffer of messages it needs to deliver to the configured log drains. As Logplex polls for log messages, old messages are discarded to make room in the buffer for new ones. Therefore, the external services receiving the messages need to be performant enough to keep up with Logplex, in order to prevent the loss of messages.
Log Drains
Logplex makes two kinds of log drains available: Syslog and HTTPS. When a log drain is created in Logplex, it’s assigned a unique drain token for the lifetime of that log drain. When you have multiple log drains configured to use the same external service URL, the drain token helps you determine which log drain forwarded the message.
You can view the configured log drains using the following command in your Heroku project:
$ heroku drains --json[
{
"addon": null,
"created_at": "2022-01-01T12:00:00Z",,
"id": "dc0e4ec4-a5bd-4ec4-dc0e-eaa8dc2dc0d",
"token": "d.0b55c011-f9c9-4428-ac9b-a5935fcf4950",
"updated_at": "2022-01-10T12:00:00Z",
"url": "syslog://logs.foo.com"
}
]
Syslog
For Syslog drains, Heroku supports forwarding the message over Transport Layer Security (TLS) or plain text, with all messages delivered in the RFC 5424 format. You can configure Syslog drains with the following commands in your Heroku project:
# Syslog over TLS$ heroku drains:add syslog+tls://logs.foo.com:3443 -a app
# Syslog over plaintext
$ heroku drains:add syslog://logs.foo.com -a app
HTTPS
The HTTPS log drain is ideal for forwarding your log messages to other web applications or services. With HTTPS drains, Logplex buffers log messages and submits batches of them through a POST request to an HTTPS endpoint. The request body contains the log in a Syslog message format. You can add an HTTPS log drain to your Heroku project using this command:
$ heroku drains:add https://user:pass@applograin.herokuapp.com/logs -a app
For HTTPS log drains, Logplex doesn’t support chunked transfer encoding of responses. Therefore, your HTTPS endpoint should respond with a Content-Length header set to 0 and not return a body. Be sure to review the caveats in the Heroku documentation for using HTTPS log drains.
Removing log drains
The following command removes any log drains you have created in your Heroku project:
$ heroku drains:remove syslog+tls://logs.foo.com:3443/#insecure -a app
If an add-on has created a log drain, however, you cannot use the above command to delete that log drain. You would need to detach or delete the add-on from your Heroku project to remove these log drains from Logplex.
Security concerns
It’s important to note the following security concerns when creating log drains in your Heroku application:
- Although HTTPS drains support HTTP Basic Authentication and transport-level encryption, they don’t validate server certificates during the TLS handshake process.
- Syslog drains do not support authentication. Transport-level encryption is completed on the certificate and hostname verification during the TLS handshake.
- If a third party knows your log server address, it can attempt to send log messages to your log server. To address this vulnerability, you should put measures in place to authenticate incoming requests by inspecting them for a known drain token.
- Syslog drains fully support recent versions of TLS (1.1 and 1.2). Older versions of TLS (1.0) and all versions of SSL (v1, 2, 3) are not supported.
Adding Heroku Logs to Falcon LogScale
The default log processing provided by Logplex is basic, intended to act as a log forwarding service to external services for further processing. One external service you can use is Falcon LogScale . By usingFalcon LogScale, you can store a longer history of log messages for your application, complete more complex querying, and perform monitoring and alerting on log and application metrics.
To integrate your Heroku applications with Falcon LogScale, you’ll first need to set up a Falcon LogScale repository for collection and grouping of your Heroku application logs. This repository can be a dedicated repository or the shared sandbox repository on your Falcon LogScale account.
To configure a log drain, run the following command in your Heroku project. This will forward logs to the Falcon LogScale repository:
$ heroku drains:add https://$INGEST_TOKEN@$YOUR_Falcon LogScale_URL/api/v1/ingest/logplex -a app
Make sure to replace YOUR_Falcon LogScale_URL with the endpoint associated with your Falcon LogScale account. Also, replace INGEST_TOKEN with the token from Falcon LogScale repository, which is found in the settings section of the repository. Once you’ve configured the drain, you’ll begin to see logs flowing into the Falcon LogScale repository. You can also reference the Falcon LogScale documentation on integrating with Heroku.
Best practices for logging in Heroku
In order to get the most from Heroku logging, you should keep in mind the following best practices.
Log what is important
If you are logging too much, then critical errors or security signals in logs might get lost in the noise. To avoid this, consider what events you want to log. A good general practice is to log unexpected or edge case events, such as authentication failures and unknown errors. These messages are noteworthy as they are clear indicators that the code is not functioning as expected, requiring more investigation by developers through monitoring or alerting.
Attach contextual information to log entries
For any events you log, it’s essential to attach important contextual information to the event. This event should include any required correlation IDs to track requests across services and any errors relevant to the event.
Tag log entries for easier querying
If you use a log management backend that encourages you to log “everything” and has robust querying capabilities, then you can use contextual information to tag log entries appropriately. That way, searching will be easier later on.
Sanitize for sensitive information
For security and data privacy reasons, it’s important for your log entries not to have sensitive information in the log message. Sensitive information can contain personally identifiable information, encryption keys, passwords, or secrets.
Use a well-structured format
When writing log messages, use a structured log message with key-value attributes, as this will allow for better querying and processing of logs. The message format utilized on the Heroku platform and all the internal services is the logfmt structure, which uses a JSON format for declaring the key-value pairs. An example of this message format is as follows:
2022-08-01T12:00:00.000000+00:00 app[worker.1]: DEBUG: event {"foo":123, "bar":456}With this format, each log line contains many key-value pairs, describing further context for a log. To analyze your log messages further, you can enable other features like in-depth metrics and more advanced querying of log messages.
To better define the context of your log message, log them using the appropriate log level. The following table describes the log levels and when you ought to use them.
| Status Code | Status Name | Status Description |
|---|---|---|
| 0 | Emergency | System has become unusable. A thrown runtime error is typically paired with a message of this log level. |
| 1 | Alert | A significant action must be taken immediately on the system to maintain regular operation. |
| 2 | Critical | A critical error or condition in the system will affect regular operation if not investigated. |
| 3 | Error | Any errors picked up at runtime, though they do not necessarily have to be thrown errors. |
| 4 | Warning | Any events or conditions that are not ideal for the system's regular operation. |
| 5 | Notice | A normal state, but could be noteworthy. |
| 6 | Informational | Any messages to provide further context on the system. |
| 7 | Debug | Message intended for debugging of the system. |
Conclusion
In this article, we covered how you can extend the processing of your Heroku applications logs by leveraging log drains to forward them to other external services. We also discussed log integrations and some recommended best practices to secure your log messages.
The Logplex service on Heroku does have some limitations. However, Falcon LogScale’s log management platform is a great way to preserve an extended history for your Heroku logs. With the gathered logs, you have access to a wide range of extra querying, analytics, and monitoring tools to make debugging your application easier and faster.
Log your data with CrowdStrike Falcon Next-Gen SIEM
Elevate your cybersecurity with the CrowdStrike Falcon® platform, the premier AI-native platform for SIEM and log management. Experience security logging at a petabyte scale, choosing between cloud-native or self-hosted deployment options. Log your data with a powerful, index-free architecture, without bottlenecks, allowing threat hunting with over 1 PB of data ingestion per day. Ensure real-time search capabilities to outpace adversaries, achieving sub-second latency for complex queries. Benefit from 360-degree visibility, consolidating data to break down silos and enabling security, IT, and DevOps teams to hunt threats, monitor performance, and ensure compliance seamlessly across 3 billion events in less than 1 second.
Arfan Sharif is a product marketing lead for the Observability portfolio at CrowdStrike. He has over 15 years experience driving Log Management, ITOps, Observability, Security and CX solutions for companies such as Splunk, Genesys and Quest Software. Arfan graduated in Computer Science at Bucks and Chilterns University and has a career spanning across Product Marketing and Sales Engineering.