Despite the strengths of Heroku as a cloud application platform, its logging capabilities are limited. Most significantly, Heroku does not retain logs permanently. This is a major impediment when identifying the root cause of an incident. This type of investigation requires being able to inspect logs from hours to days ago.
To achieve a longer retention period for logs, we need to send our logs to a third-party, centralized logging platform, such as Crowdstrike Falcon® LogScale.
In this post, we dive deeper into how the Falcon LogScale integration works. We look at how we can use Falcon LogScale’s powerful features to query and analyze logs received from Heroku, and how Heroku logs generally integrate with third-party platforms.
Learn More
Explore the complete Heroku Logging Guide series:
- Part 1: The Basics
- Part 2: Advanced Concepts
- Part 3: CLI Cheat Sheet and Private Space Logging
- Part 4: Integrating With CrowdStrike Falcon LogScale (Coming Soon)
Integrating Heroku Logs with Centralized Platforms
By default, Heroku only retains the most recent 1,500 lines of an application log. While this may be useful for basic debugging, better enterprise logging solutions are needed for any more intensive investigative tasks. The size of enterprise application logs can sometimes be measured in gigabytes (or even terabytes). Why might you need the retention of more log data for longer periods of time?
First, the more users an application has, the more logs it produces. An application with many users can potentially produce thousands of log records in seconds. This renders the last 1,500 lines virtually useless for extracting valuable data.
Second, application logs serve not only for debugging and root cause analysis but they can also be used for sophisticated web analytics, such as clickstream analysis. With logging almost all user actions, the last 1,500 lines would not prove helpful for any serious analysis.
Fortunately, we can stream the logs from our applications to third-party logging backends by using drains. It’s important to keep in mind that not all logging platforms are simple to use, and different platforms offer different features. For example, some logging platforms lack good querying tools, and others may not contain extensive visualization support.
Enterprise applications require enterprise logging solutions. They need solutions that scale massively. Querying logs quickly and precisely is a must-have feature for a centralized logging platform. When solving a critical error, time is of the essence; therefore, an enterprise logging platform must contain a high-performance search engine.
ELK Solutions
One popular log retention and analysis option is the ELK stack: ElasticSearch, LogStash and Kibana. Each of these components handles a specific role:
- ElasticSearch is a search engine known for its high performance and speed.
- LogStash is a data ingestion tool that can accept data/logs from various sources and forward them to ElasticSearch.
- Kibana is a data visualization tool that provides users with charts and graphs that are easy to interpret.
Although this stack generally works, its main disadvantage is that it requires manual setup, configuration and a lot of engineering maintenance. Each of these components must be deployed to a server and properly managed. Some issues that can occur during this process require a lot of effort to solve, requiring engineering time that should be focused on other more critical business problems.
CrowdStrike Falcon LogScale
As a fully managed enterprise logging solution, this is where CrowdStrike Falcon LogScale proves its value: bringing together data ingestion, retention, search and visualization into one powerful tool that requires minimal effort to maintain.
How to Send Logs from Heroku to Falcon LogScale
In Heroku, log drains can forward logs to third-party platforms. We can use this method to send logs to Falcon LogScale as well.
Start by creating a repository in our Falcon LogScale account, which will serve as the destination for our application logs. Log into your Falcon LogScale account. Under the Repositories and Views tab, click on the Add New button
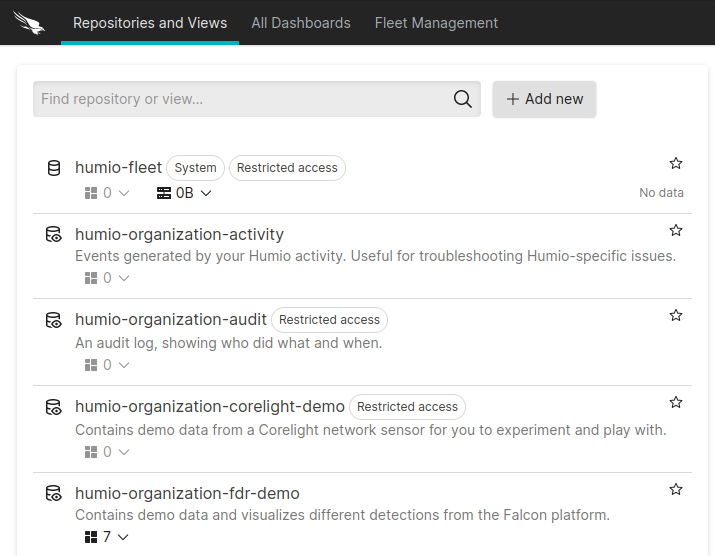
Complete the details for your new repository. Then, save your configuration.
Create an Ingest Token
Next, create an ingest token to serve as an authentication method. This step prevents malicious actors from sending data to our repository.
Under the Settings tab for your repository, go to Ingest Tokens and click Add Token.
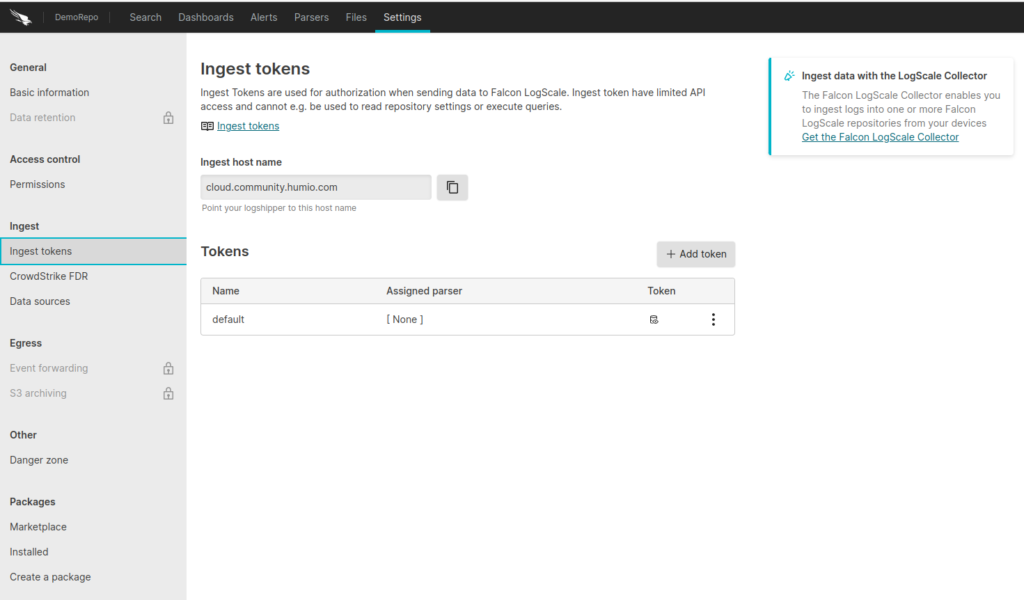
After adding the token, copy the token value to a safe location.
Create the Drain in Heroku
After creating a Falcon LogScale repository and ingest token, we can now create the log drain in Heroku. Assuming we have a Heroku application called my-app, we run the following command with the Heroku CLI:
$ heroku drains:add https://$INGEST_TOKEN@$LOGSCALE_URL/api/v1/ingest/logplex -a my-app
Make sure that you have inserted your ingest token to replace $INGEST_TOKEN above, and use the appropriate Falcon LogScale URL (which will depend on your account type) for $LOGSCALE_URL.
After creating the log drain, you will see your Heroku application logs in your Falcon LogScale repository.
Search Heroku Logs with LogScale
To search through your application logs, use the LogScale Query Language. The language syntax is very straightforward, so let’s look at some of its most used features with examples.
Query filters
When searching through logs, we often want to search for specific keywords. We can use query filters to do this. For example, if we wish to find all log entries that contain the word “error”, then we can filter the logs for this keyword by entering it in the search bar. If we want to add whitespace in the keyword, we can use quotes like this:
“ error “
We can also filter by searching specific fields of our logs and use wildcards. For example, to find log entries that contain the word “error” in the message field, we would use this query:
message = *error*
This is useful for situations where certain errors have different names, such as “TypeError” or “KeyError”.
We can also include regular expressions in our query filters, like this:
level = /error/i
This regex will return all log entries with a level of “error”, but it will perform a case-insensitive search. Therefore, the query result will include logs with levels such as “Error” or “ERROR”.
Comparison operators
Comparison operators are useful when filtering specific integer values, such as status codes, or application logs containing numerical values.
If our application is an HTTP server, we might retrieve all logs showing server-side errors to identify what is causing these issues. We would formulate the query to look like this:
statuscode >= 500
We can also use logical operators with keywords, such as and, or and not:
statuscode=500 and (method=GET or method=POST)
Joins
The join function can produce results from a combination of queries:
statuscode=500 | join({method=GET},field=host)Function Syntax
Certain built-in Falcon LogScale query language functions accept custom functions as arguments, which we can define by using the function syntax. A good example is the groupBy function:
groupBy(responseTime, function={average := avg(responseTime)})Best Practices for Writing Efficient Queries in Falcon LogScale
To improve performance and avoid unnecessarily broad query results, keep in mind the following best practices:
- Filter the data correctly to return relevant results.
- Use aggregate query functions that will group the data by relevant fields.
- Define relevant time ranges to narrow the results, showing only time ranges in which you are interested.
- Save your queries for future use. There’s a good chance that you will run the same or similar queries in the future.
Log your data with CrowdStrike Falcon Next-Gen SIEM
Elevate your cybersecurity with the CrowdStrike Falcon® platform, the premier AI-native platform for SIEM and log management. Experience security logging at a petabyte scale, choosing between cloud-native or self-hosted deployment options. Log your data with a powerful, index-free architecture, without bottlenecks, allowing threat hunting with over 1 PB of data ingestion per day. Ensure real-time search capabilities to outpace adversaries, achieving sub-second latency for complex queries. Benefit from 360-degree visibility, consolidating data to break down silos and enabling security, IT, and DevOps teams to hunt threats, monitor performance, and ensure compliance seamlessly across 3 billion events in less than 1 second.