Application logging helps developers debug when problems occur, creating an audit trail for when certain code paths are executed. However, setting up the related infrastructure and services to ingest and access these logs can be too much extra work for a development team to take on.
You can simplify this setup by using a service like Heroku, which provides a platform as a service (PaaS) for hosting and operating web applications in the cloud. These platforms abstract away common issues for operating software, such as scaling your application and integrating logging across those services that make up your application. You can enable this service via their developer-focused CLI tools and web console, allowing you to build and run your applications faster.
This post is part one of a series exploring Heroku logging. In this first part, we will cover the basics of Heroku logging: the message format and the attributes available to you, while using the Heroku CLI tool to inspect and explore the captured logs for your application.
Learn More
Explore the complete Heroku Logging Guide series:
- Part 1: The Basics
- Part 2: Advanced Concepts
- Part 3: CLI Cheat Sheet and Private Space Logging
- Part 4: Integrating With CrowdStrike Falcon LogScale
What is Heroku?
Heroku is a container-based PaaS. It provides you with the services you need to build, deploy, and operate applications in the cloud. The processes of your application, like an API server or web application, run in a dyno. Heroku creates a dyno as a container for the process and allows you to scale the number of dynos used for your applications (according to your needs).
Heroku provides a complete deployment workflow from source code commit to the deployment of your application on the Heroku cloud. Applications that are easily configured to run in a cloud are ideal for working on Heroku. Additionally, those designed with the principles of the Twelve-Factor App are best suited for the Heroku platform. Below is an example of the Heroku architecture:
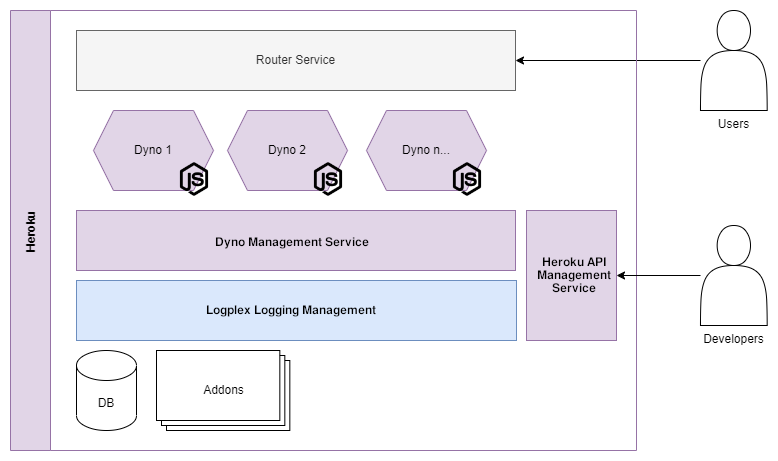
Developers define the processes and dependencies of their application in the application source code. They can use commits pushed to Heroku's private git server as a trigger for application deployments. The programming languages supported by Heroku include the following:
- JavaScript
- Java
- PHP
- Python
- Go
- Scala
Understanding Heroku Logging
For applications deployed to Heroku, log messages produced by your application are output as streams of timestamped messages, allowing you to query important events for monitoring or debugging purposes. A sample log message looks like this:
2022-08-23T11:03:17.088866+00:00 app[web.1]: > node index.js2022-08-23T11:03:17.088866+00:00 app[web.1]:
2022-08-23T11:03:17.216976+00:00 app[web.1]: Listening on 53527
2022-08-23T11:03:17.512229+00:00 heroku[web.1]: State changed from starting to up
All log streams collected by the Heroku logging service, Logplex, are combined into a single stream, accessible through the Heroku CLI. Each log message created in a Heroku application will include the following attributes, which are attached to the message by Logplex.
Timestamp: This is an RFC5424-formatted string for the time the log message was produced in the dyno or application process.
Source: All your application processes running in dynos, background workers, or scheduled tasks will have log messages with the source app, while internal platform requests will have the source Heroku.
Dyno: Each application process will run on a dyno with a unique ID, such as worker.1, worker.2, and so on. You can use this attribute to fetch all related logs for a specific dyno.
Message: This attribute contains the complete log message sent. You can query if this message contains specific substrings or regex matches. As Heroku processes these messages, it will split contents that exceed 10,000 bytes into multiple messages.
Types of Heroku Logs
Logs collected from your Heroku application will fall into two major buckets: runtime logs and build logs. Runtime logs include your application and all of its processes. Within your application's runtime logs, the following categories of logs are captured and accessed via the source attribute of the log message.
Application logs: These are the log messages emitted from your application processes. These include all your application log messages and any of the application dependencies.
System logs: These are messages produced by the Heroku platform's infrastructure to support running your application, tagged with the source attribute Heroku. Messages can include the HTTP router logs, dyno managing your applications processes, or errors that were caught.
API logs: When developers interact with your application on the Heroku platform through the CLI tool or web console, the API interactions generate logs to audit the activity on the platform. You can use the following command to filter out the API messages that have run on the internal API dyno: heroku logs --source app --dyno api.
Add-on logs: Any add-ons to your Heroku application will have their log messages tagged with a value specified for the add-on.
The second bucket of log messages is the build logs generated by the Heroku platform. These include:
- Logs generated during the build process for your application
- Logs generated by the backend services in the Heroku API service, such as the Heroku API or any add-ons in your application.
If you are having any problems with your deployment, then you can see the logs related to this process in your Heroku application’s build logs.
Working with Heroku Logs
In this section, we will discuss in greater detail how to inspect the logs produced by your deployed Heroku application. In your Heroku project, you can run the heroku logs command to retrieve an output of the records produced by your application.
$ heroku logs2022-08-23T11:03:14.000000+00:00 app[api]: Build succeeded
2022-08-23T11:03:15.186679+00:00 heroku[web.1]: Starting process with command `npm start`
2022-08-23T11:03:17.088840+00:00 app[web.1]:
2022-08-23T11:03:17.088866+00:00 app[web.1]: > node-js-getting-started@0.3.0 start
2022-08-23T11:03:17.088866+00:00 app[web.1]: > node index.js
2022-08-23T11:03:17.088866+00:00 app[web.1]:
2022-08-23T11:03:17.216976+00:00 app[web.1]: Listening on 53527
2022-08-23T11:03:17.512229+00:00 heroku[web.1]: State changed from starting to up
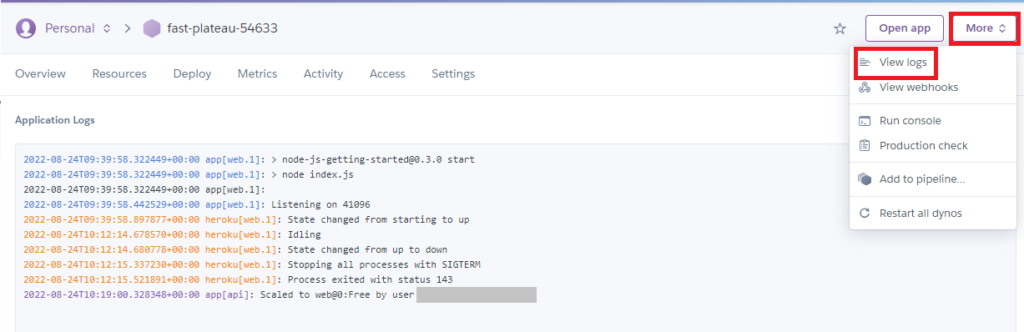
You can also view these same logs through the Heroku web UI. Below, you can see the runtime logs for a deployed Heroku application.
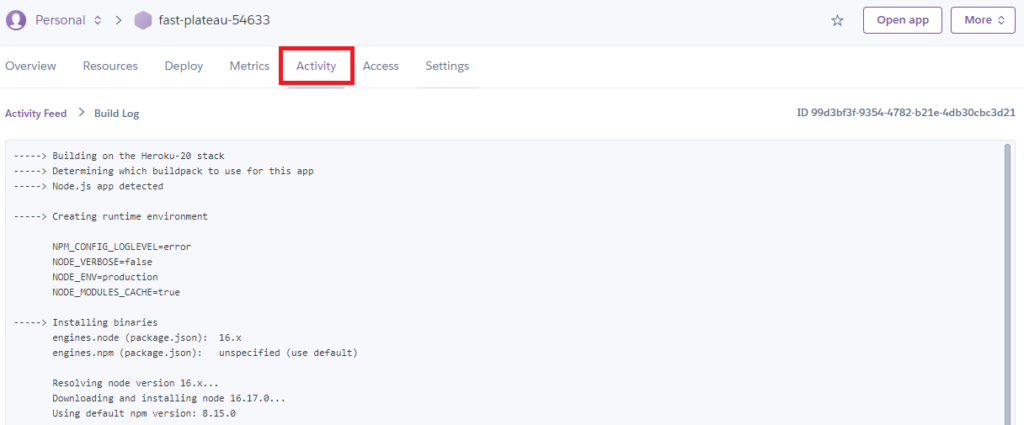
Through the web UI, the build logs for the application are also available to view, allowing you to see any issues that may have surfaced during the build and deployment process.
Let’s suppose that you already have other log processing setups for your application. In that case, you can set up log drains to export log messages from Heroku to other applications in a standard protocol, like Syslog.
$ heroku drains:add syslog+tls://example.com:6514 -a app
Using the Heroku CLI, you can easily customize the amount of log data you access to find the issues you are debugging. As shown previously, the heroku logs command can fetch all available logs for a deployed service. To retrieve a certain number of log messages, you can use the -n flag.
$ heroku logs -n 200
Similar to using the tail command on a Linux machine, you can also use the Heroku CLI to tail the logs emitted from your application.
$ heroku logs --tail
Finally, using the log message attributes mentioned earlier, you can filter the messages to include only those that come from specific sources.
$ heroku logs --source app
Logplex is not designed for storage and will only store the last 1,500 log messages captured. You can set up logging add-ons or a custom log drain if your application’s logs need longer-term storage or query requirements.
Log your data with CrowdStrike Falcon Next-Gen SIEM
Elevate your cybersecurity with the CrowdStrike Falcon® platform, the premier AI-native platform for SIEM and log management. Experience security logging at a petabyte scale, choosing between cloud-native or self-hosted deployment options. Log your data with a powerful, index-free architecture, without bottlenecks, allowing threat hunting with over 1 PB of data ingestion per day. Ensure real-time search capabilities to outpace adversaries, achieving sub-second latency for complex queries. Benefit from 360-degree visibility, consolidating data to break down silos and enabling security, IT, and DevOps teams to hunt threats, monitor performance, and ensure compliance seamlessly across 3 billion events in less than 1 second.
Arfan Sharif is a product marketing lead for the Observability portfolio at CrowdStrike. He has over 15 years experience driving Log Management, ITOps, Observability, Security and CX solutions for companies such as Splunk, Genesys and Quest Software. Arfan graduated in Computer Science at Bucks and Chilterns University and has a career spanning across Product Marketing and Sales Engineering.