Importing Logs from Winlogbeat into Falcon LogScale
Getting Started
Although CrowdStrike Falcon® LogScale, previously known as Humio, is a leading observability technology for handling containerized and cloud-based logs and events, Falcon LogScale also makes it easy to ingest Windows event logs. We do this by leveraging Winlogbeat by Elastic.
Winlogbeat is a native Windows event-log shipping agent usually installed as a Windows service. We can use Winlogbeat to collect and transmit event logs to multiple destinations, including LogScale.
This how-to guide will walk you through setting up Winlogbeat (open-source version) on a Windows host and configuring it to publish logs and events to a LogScale repository. We’ll verify our setup by demonstrating some example queries, showing the immediate value of our implementation.
Set Up LogScale
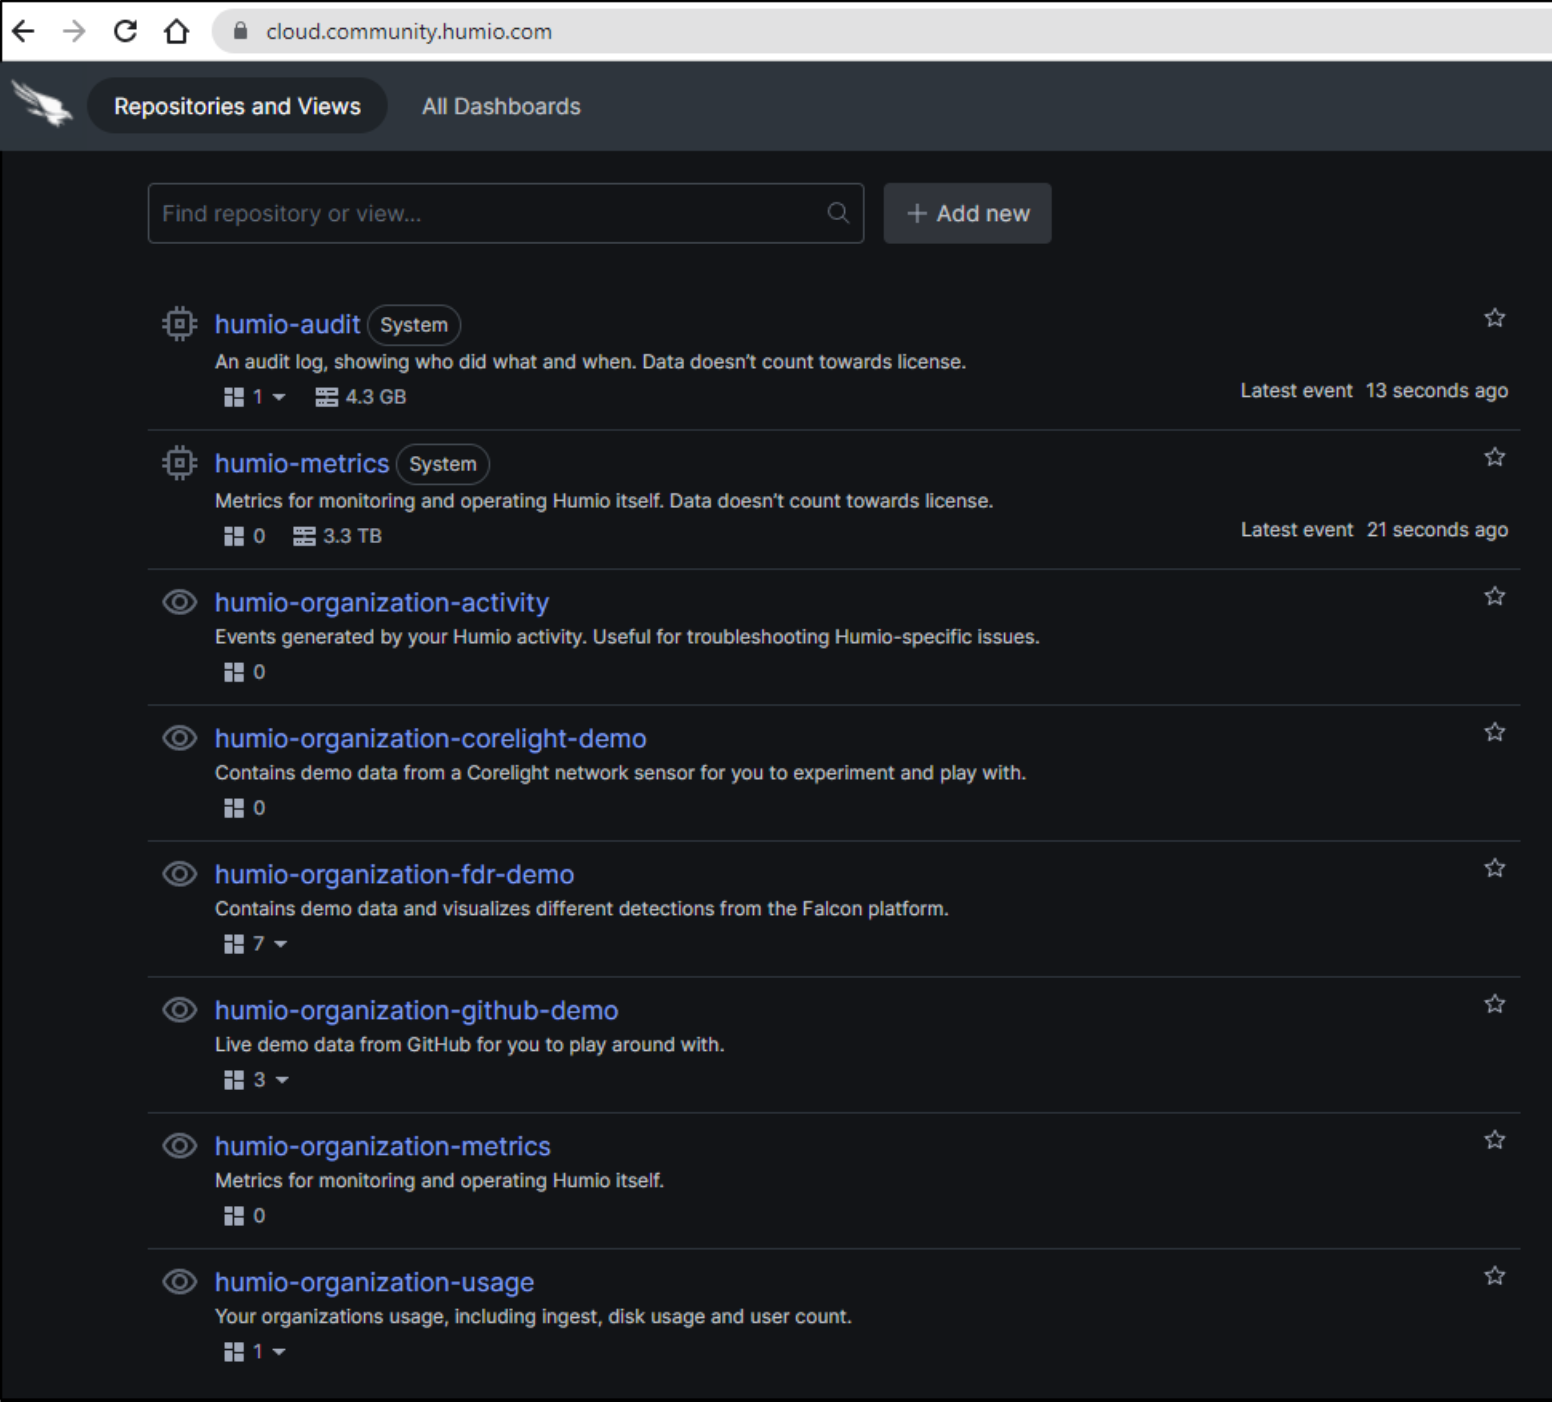
To use LogScale, you will need a LogScale account. You can sign up for the Falcon LogScale Community Edition. After logging in, we can view all of our LogScale repositories.
Create a new LogScale repository
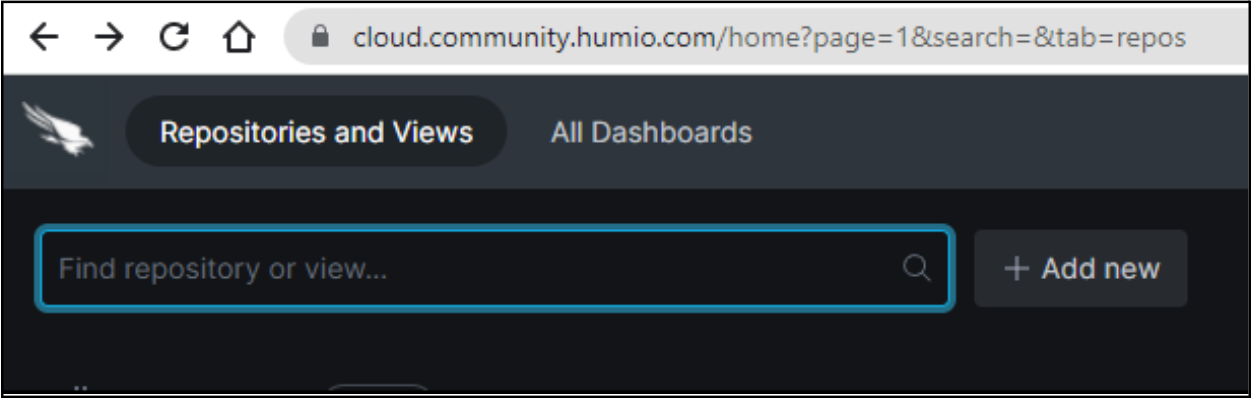
We start by creating a repository. We click + Add new.
We select Repository to add a repository.
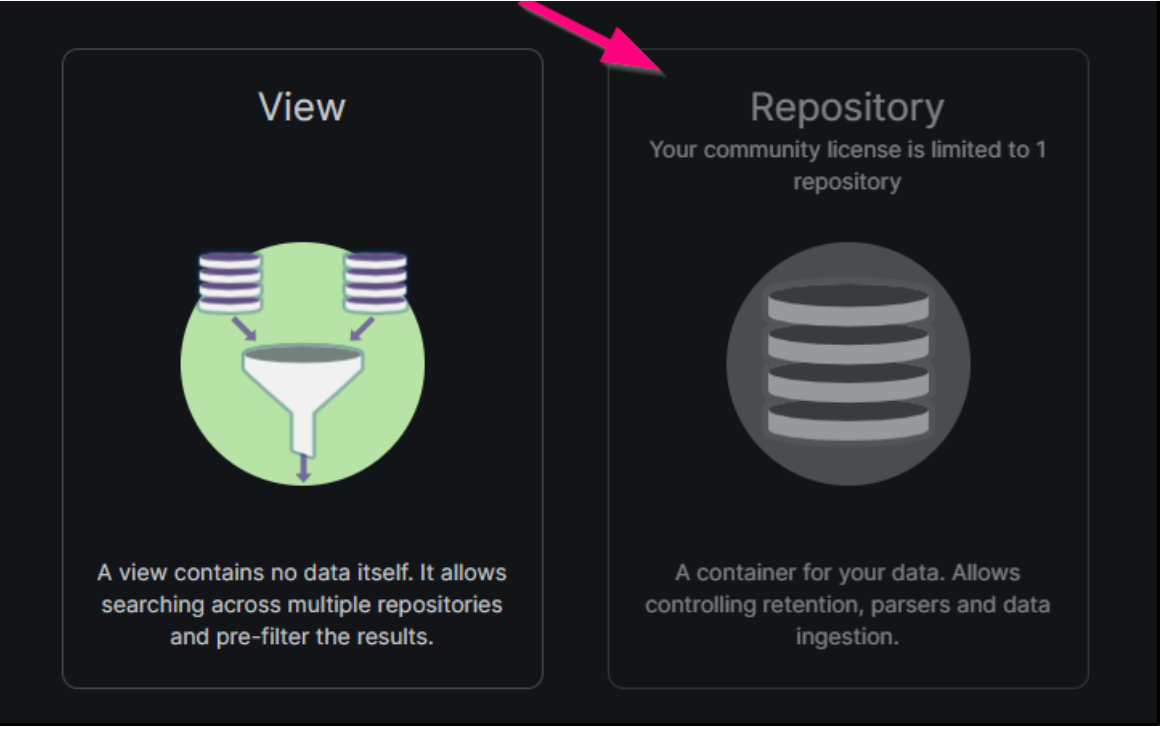
Note: LogScale Community Edition allows for only one repository. If you already have an existing repository, you’ll need to remove it before you can add a new one, or use the previously created repository for this data.
We need the ingest token for this new repository, which Winlogbeat will use for authentication when sending log data to LogScale. We navigate to the Ingest Tokens page of our new repository settings, and we click Add Token.
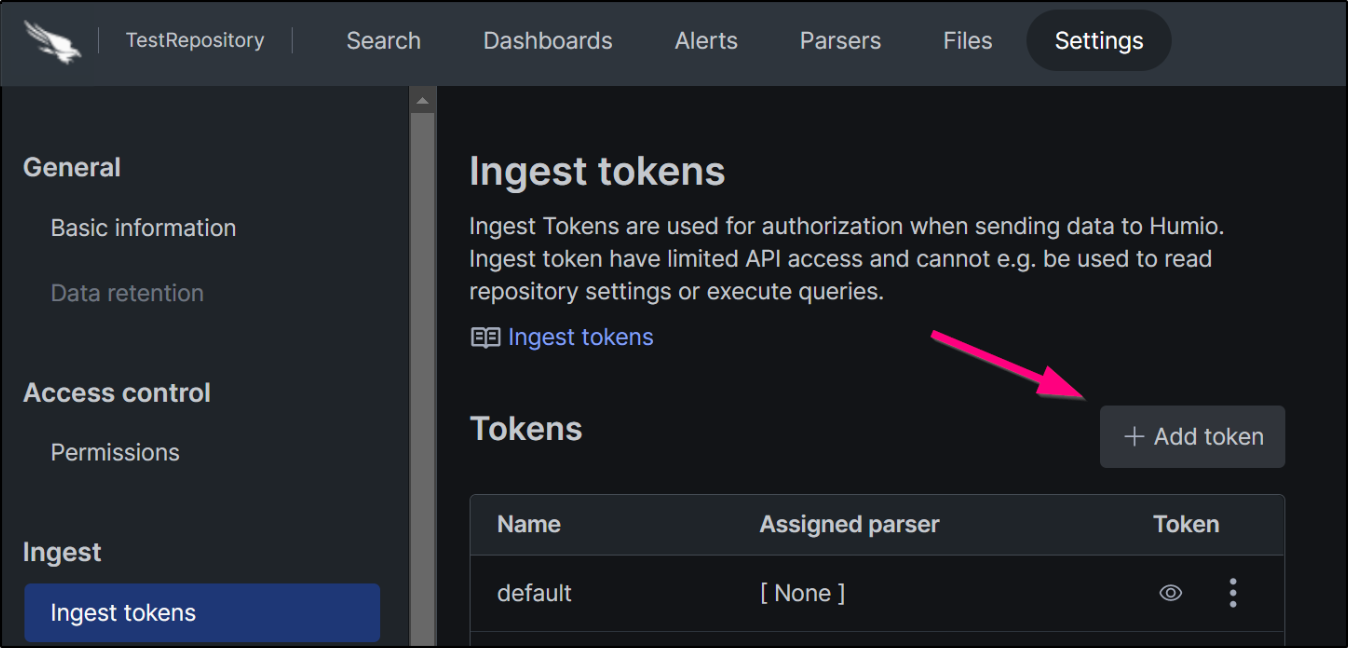
After entering a name and ingest format to associate with the token, we can view it to copy its value.
We’ll use this token value as the password for Winlogbeat shortly.
Set Up Winlogbeat
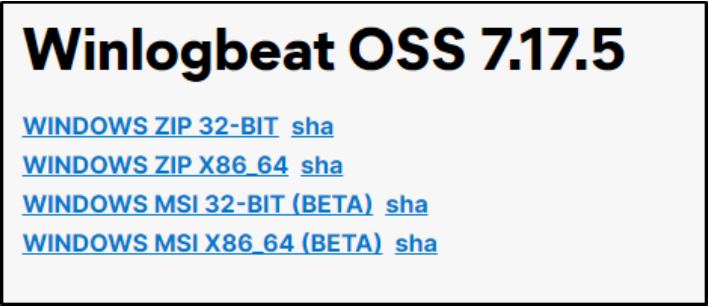
The version of Winlogbeat that works with LogScale is the open-source edition (Winlogbeat OSS). Elastic also provides a standard edition, but that version is designed only to work with their own products.
Install Winlogbeat
We go to the downloads page for Winlogbeat OSS and choose the latest download. Because of some known issues with 8.0 and above, we’ll opt for the latest 7.x version. We can use the new beta MSI package for an easier install.
Edit configuration settings
After accepting the license and completing the installation, we navigate to the data directory for Winlogbeat.
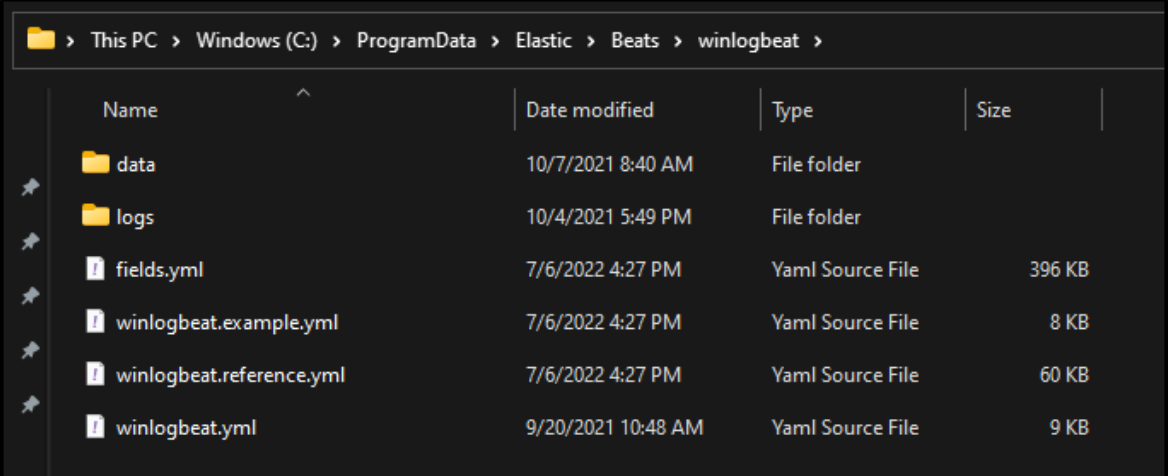
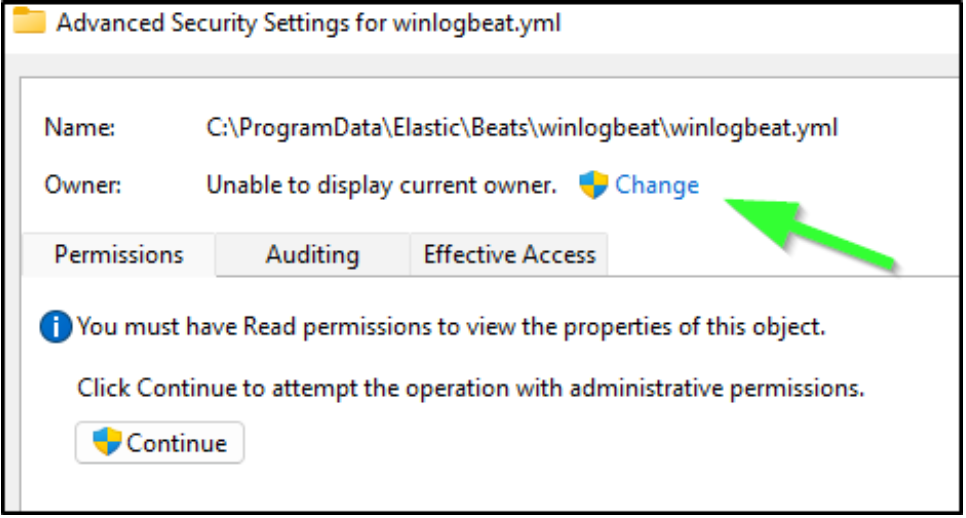
We’ll need to edit winlogbeat.yml. However, you might need to modify the file permissions to be allowed to read and edit the file. Right-click the file and choose properties. Then, navigate to the Security tab. If you don’t have read/edit permissions, you’ll need to use the Advanced options dialog to make yourself the owner of the file.
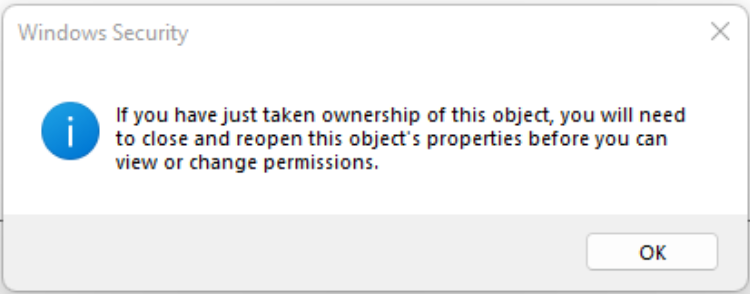
After doing this, you’ll be prompted to re-open the file.
Ensure we are capturing the correct logs
With file permissions set correctly, we can open the file in an editor like Visual Studio Code.
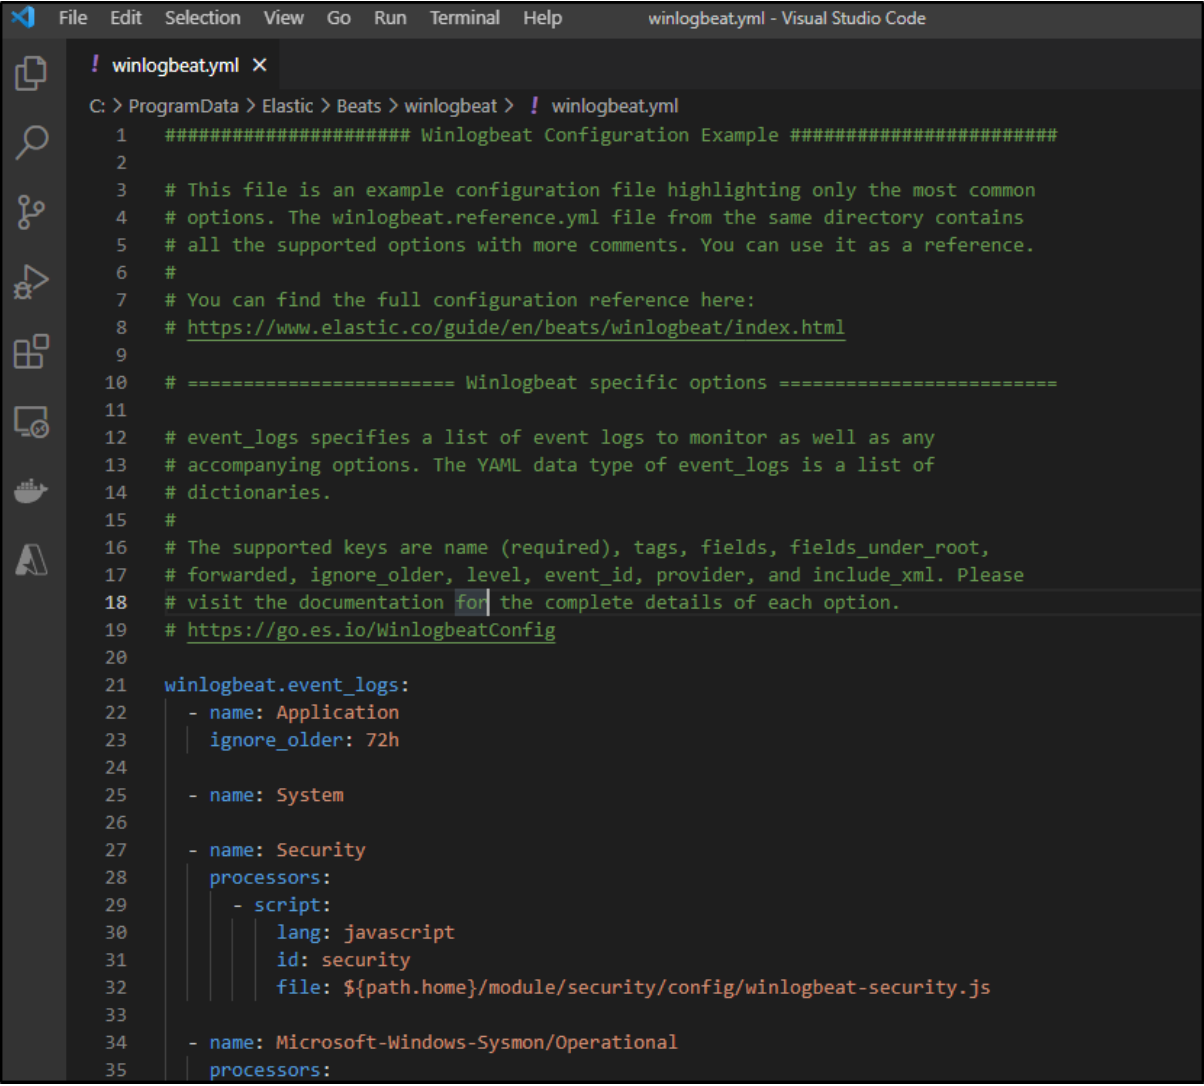
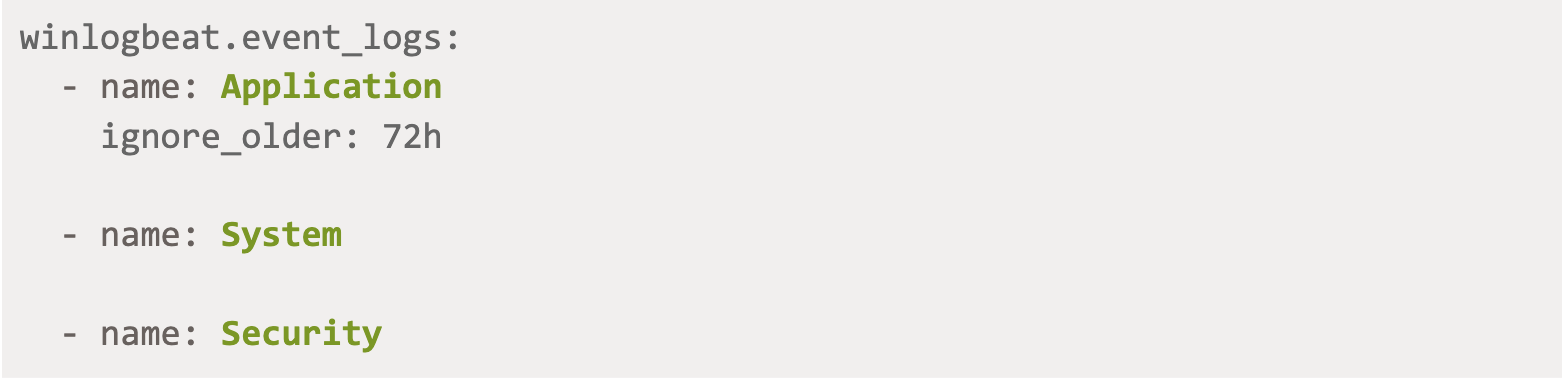
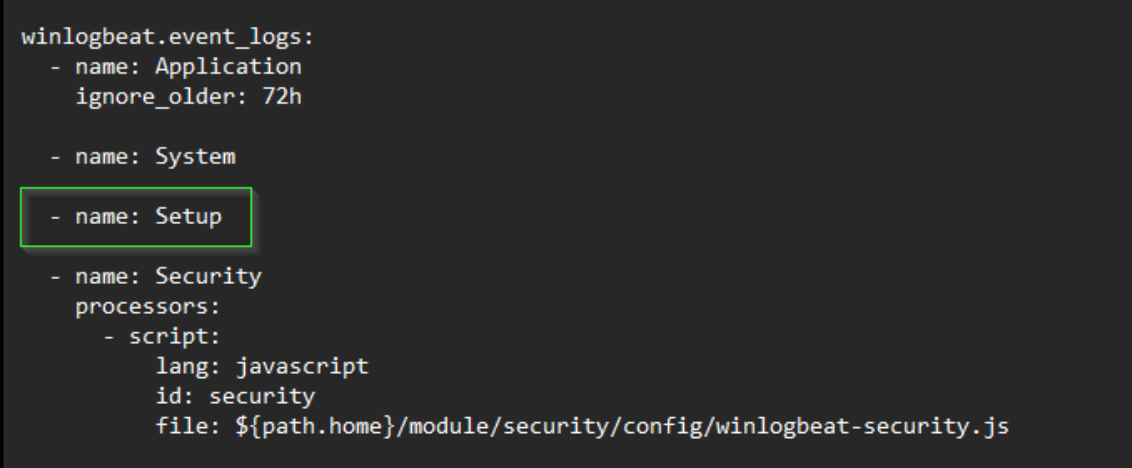
We verify that we are pulling in the application, system, and security events.
Add configuration settings for LogScale
Next, we scroll down to the commented-out section for Elasticsearch.
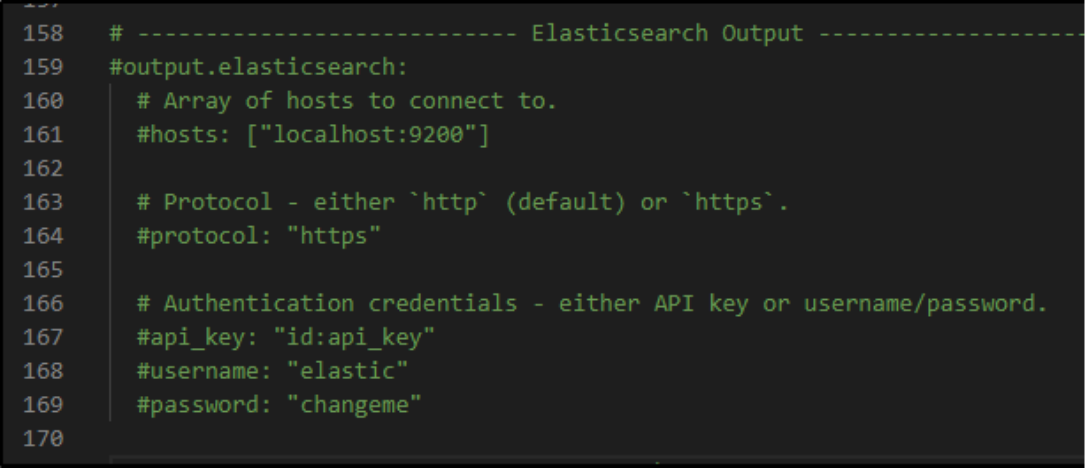
We will want to use our LogScale Elastic ingestion endpoint. For LogScale Community Edition, the hosts value is:
hosts: ["https://cloud.community.humio.com/api/v1/ingest/elastic-bulk"]
For other types of LogScale accounts, you can reference all of LogScale’s available endpoint URLs here.
The password will be your LogScale repository ingest token which you copied from above.
password: "****************************************************"
Lastly, ensure we are using the HTTPS endpoint:
protocol: "https"
Start the Winlogbeat service
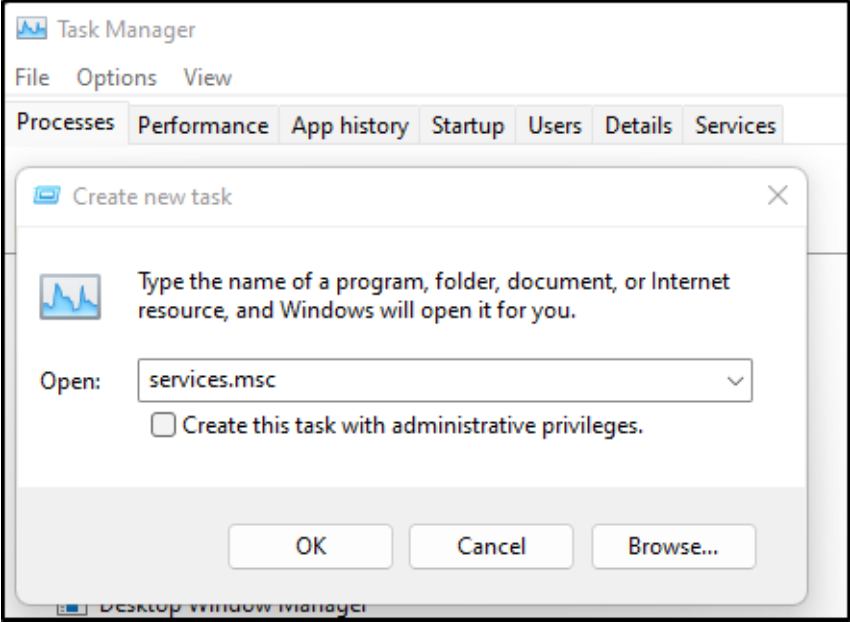
Lastly, we need to start the Winlogbeat service with these new settings. We open up Services by going to the Task Manager, choosing File/Run New Task, and entering services.msc.
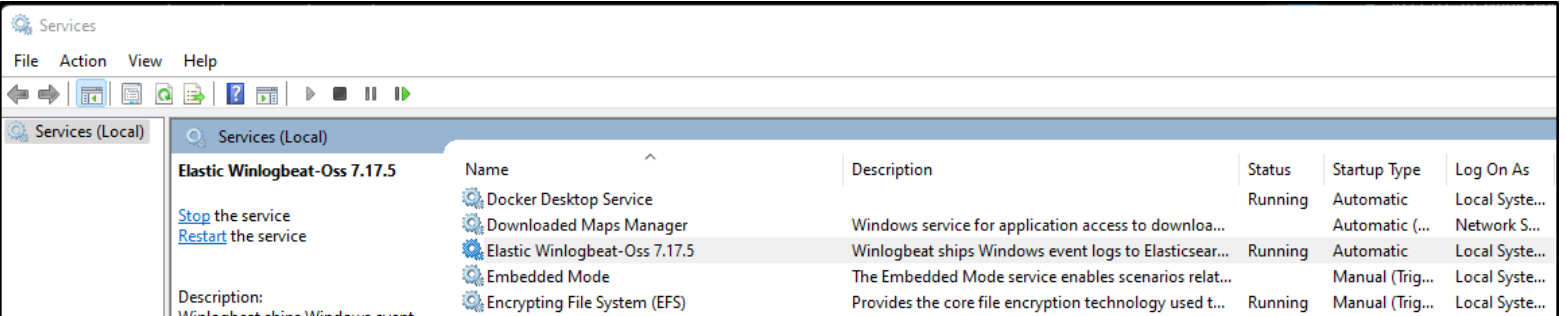
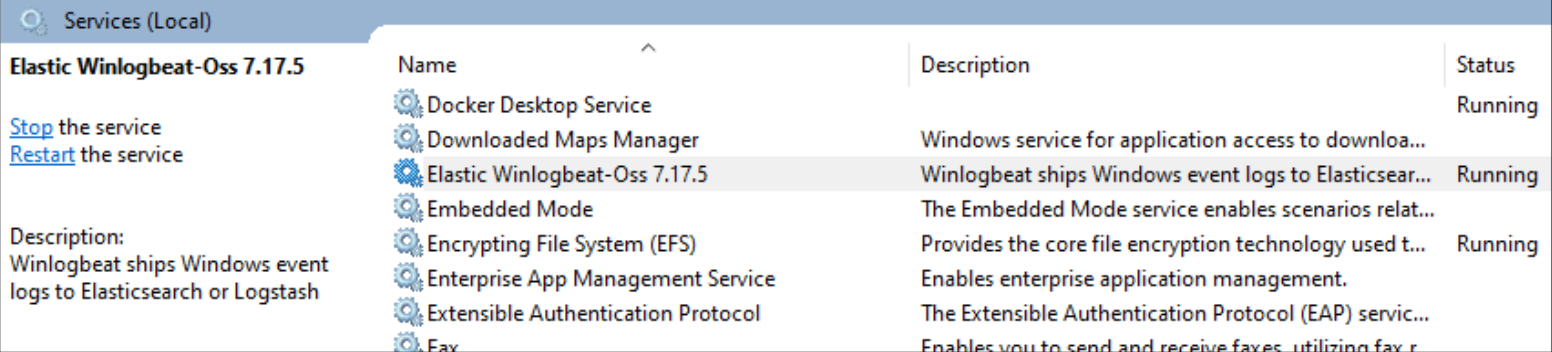
In the list of services, we see the Winlogbeat service.
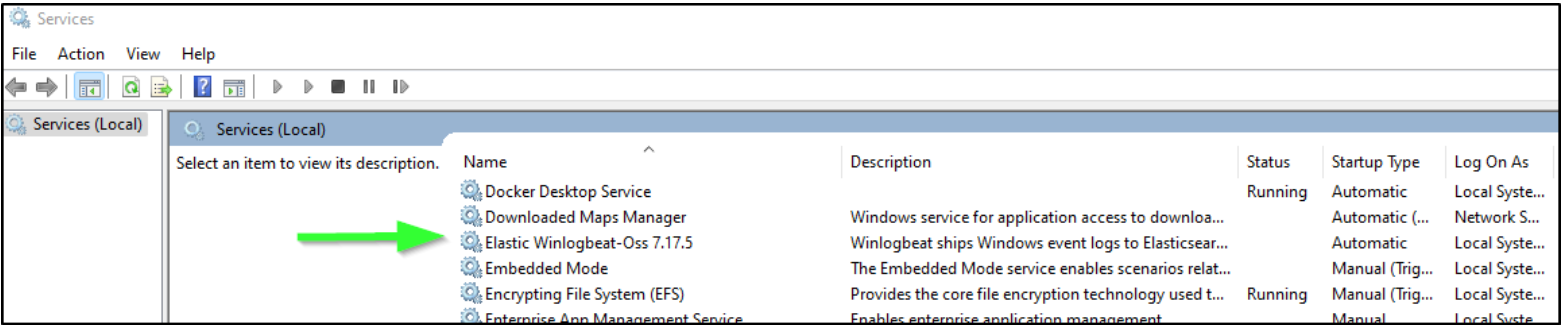
Right-click the service and choose Start.
Validating our configuration
If you have trouble starting Winlogbeat, your problem might be in the configuration YAML file. You can test the file using the winlogbeat command-line application.
For example, let’s say we had accidentally configured two different outputs. We run the following test:
C:\ProgramData\Elastic\Beats\winlogbeat>"C:\Program Files\Elastic\Beats\7.17.5\winlogbeat.cmd" test config winlogbeat.yml
Exiting: error unpacking config data: more than one namespace configured accessing 'output' (source:'C:\ProgramData\Elastic\Beats\winlogbeat\winlogbeat.yml')
The results of the configuration test should help you determine what’s going on with your setup.
If your installation was successful and your YAML configuration file is valid, then the test should give the following result:
C:\ProgramData\Elastic\Beats\winlogbeat>"C:\Program Files\Elastic\Beats\7.17.5\winlogbeat.cmd" test config winlogbeat.yml

Config OK
Once started, you should see the Service is running.
Verifying Results at LogScale
With everything running and connected, we can verify our results with some sample queries.
Example query 1: Show Windows Security SPP entries
Back in our LogScale repository, we can start to comb through the results coming in. For instance, we can filter down our results to just show Windows Security SPP entries. We use the following query: event.provider = “Microsoft-Windows-Security-SPP”.
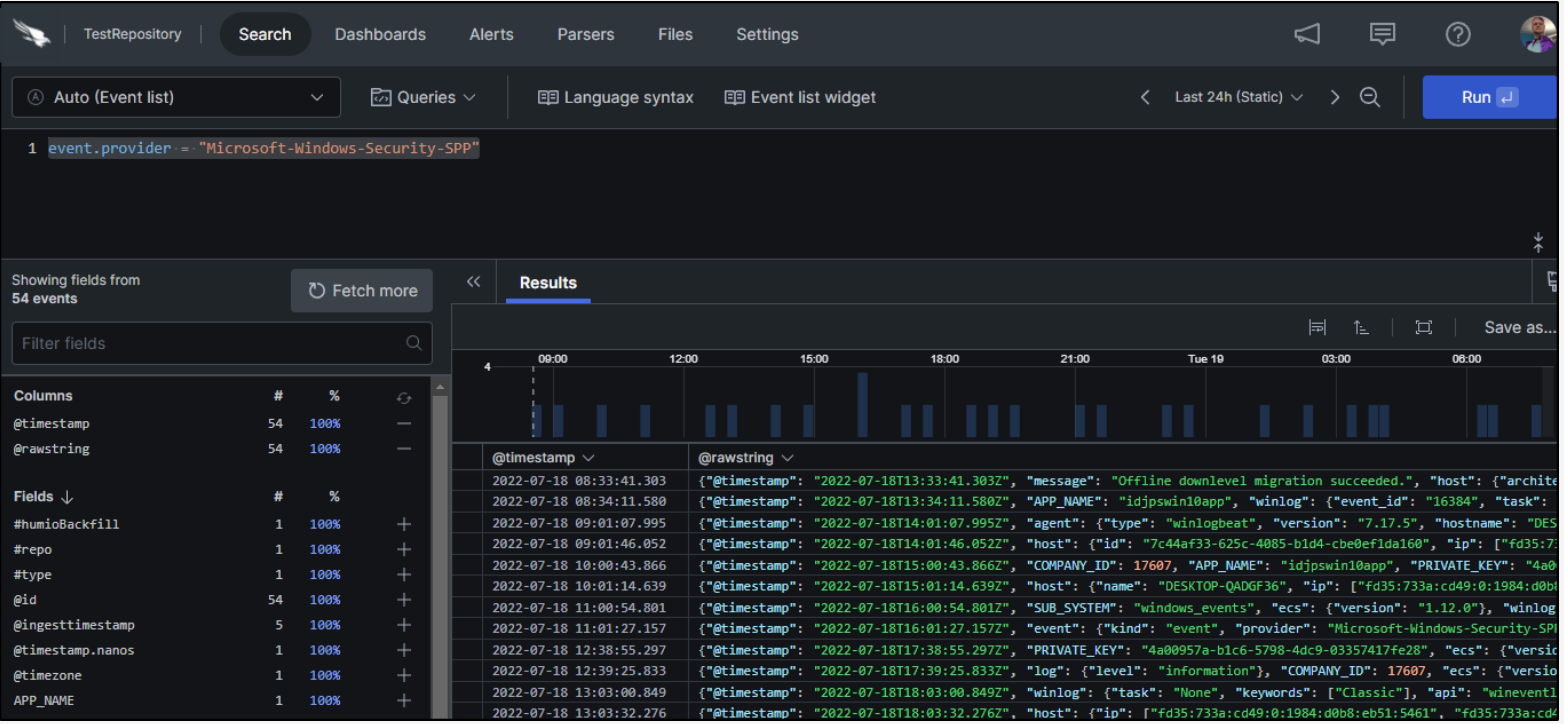
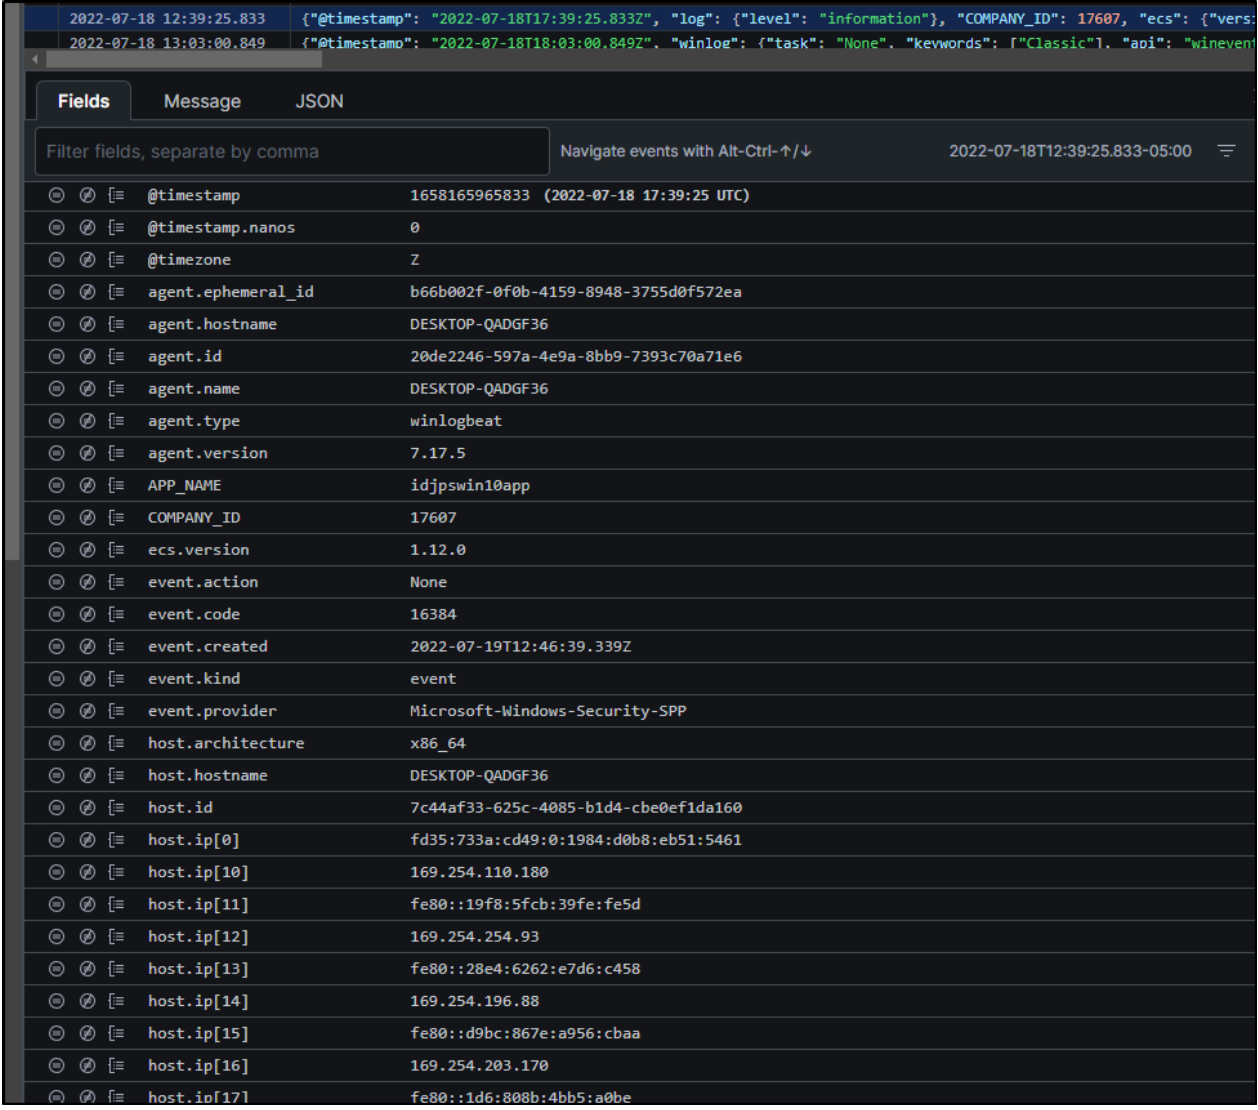
Looking at each result in the list, we can see some of the many fields LogScale collects on our behalf.
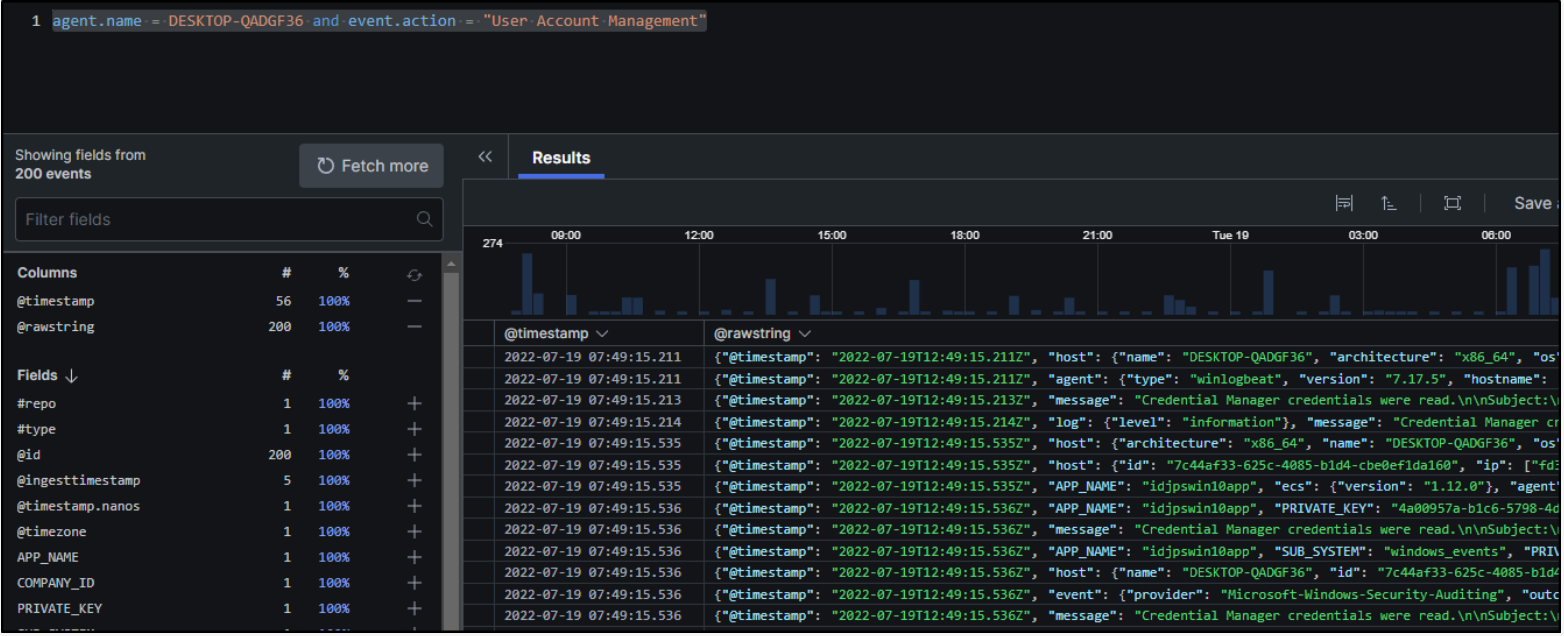
Example query 2: Show specific activities on a specific host
As another example, let’s assume that we want to find User Event Management activities on a specific host. We could do that with the query agent.name = (Hostname) and event.action = “User Account Management”.
Collecting Windows Setup Events and More
In our initial Winlogbeat configuration, we set up the service to collect application, system, and security events. What if we also wanted to collect and ship Windows setup events?
We can open the Event Viewer in Windows to see the name of the log we wish to capture.
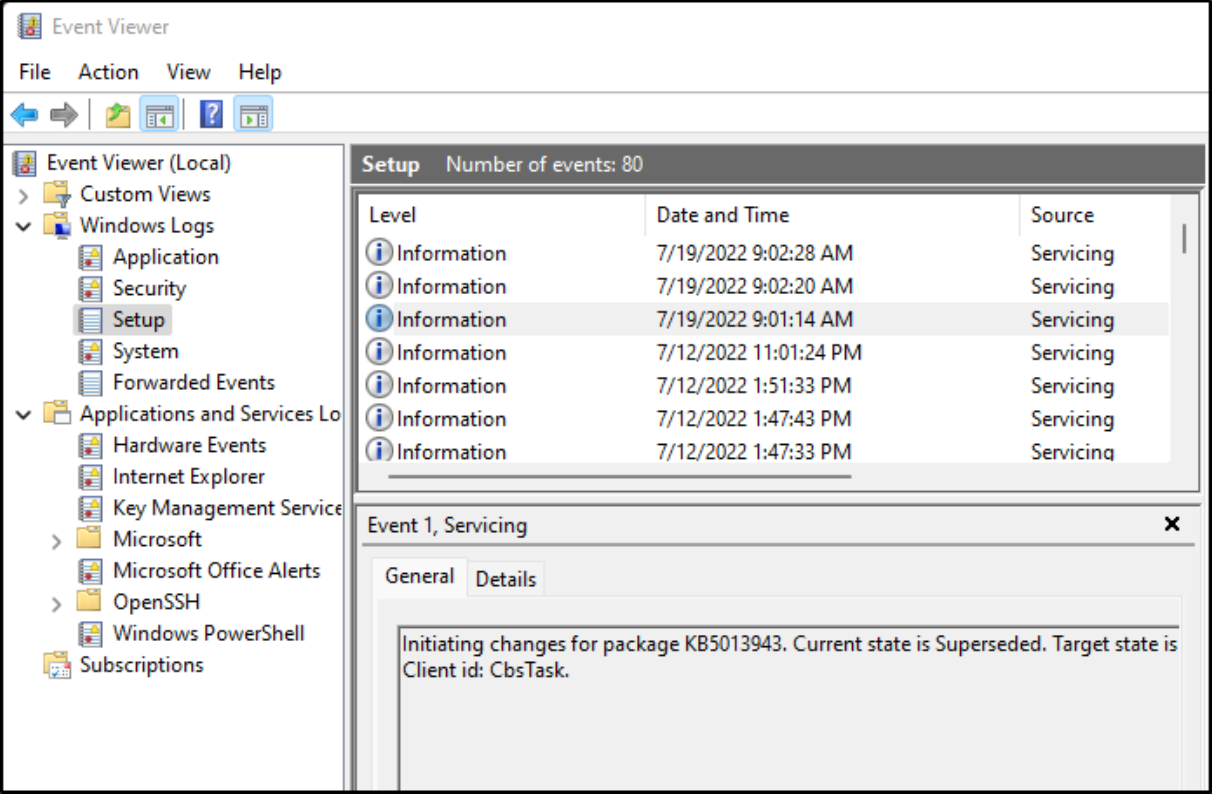
We see that the log is called “Setup.” So, we’ll update our winlogbeat.yml file to add a line for that log.
In the list of services, we right-click on the Winlogbeat service and choose restart to have the changes take effect.
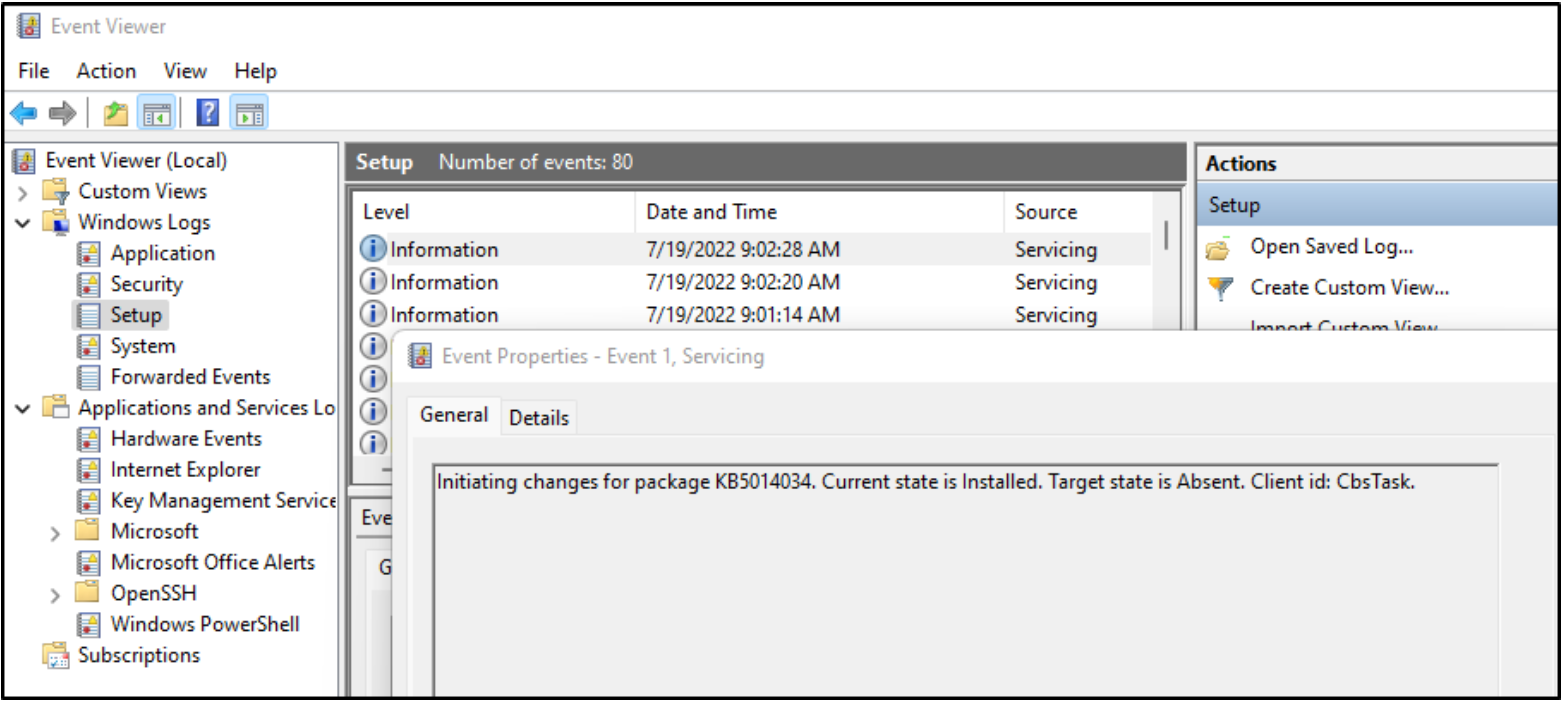
To verify that this is working, we start by looking at our Windows Event Viewer for a recent setup event.
Then, we go to LogScale and use the following query: agent.name = (HOST NAME) | winlog.channel = Setup.
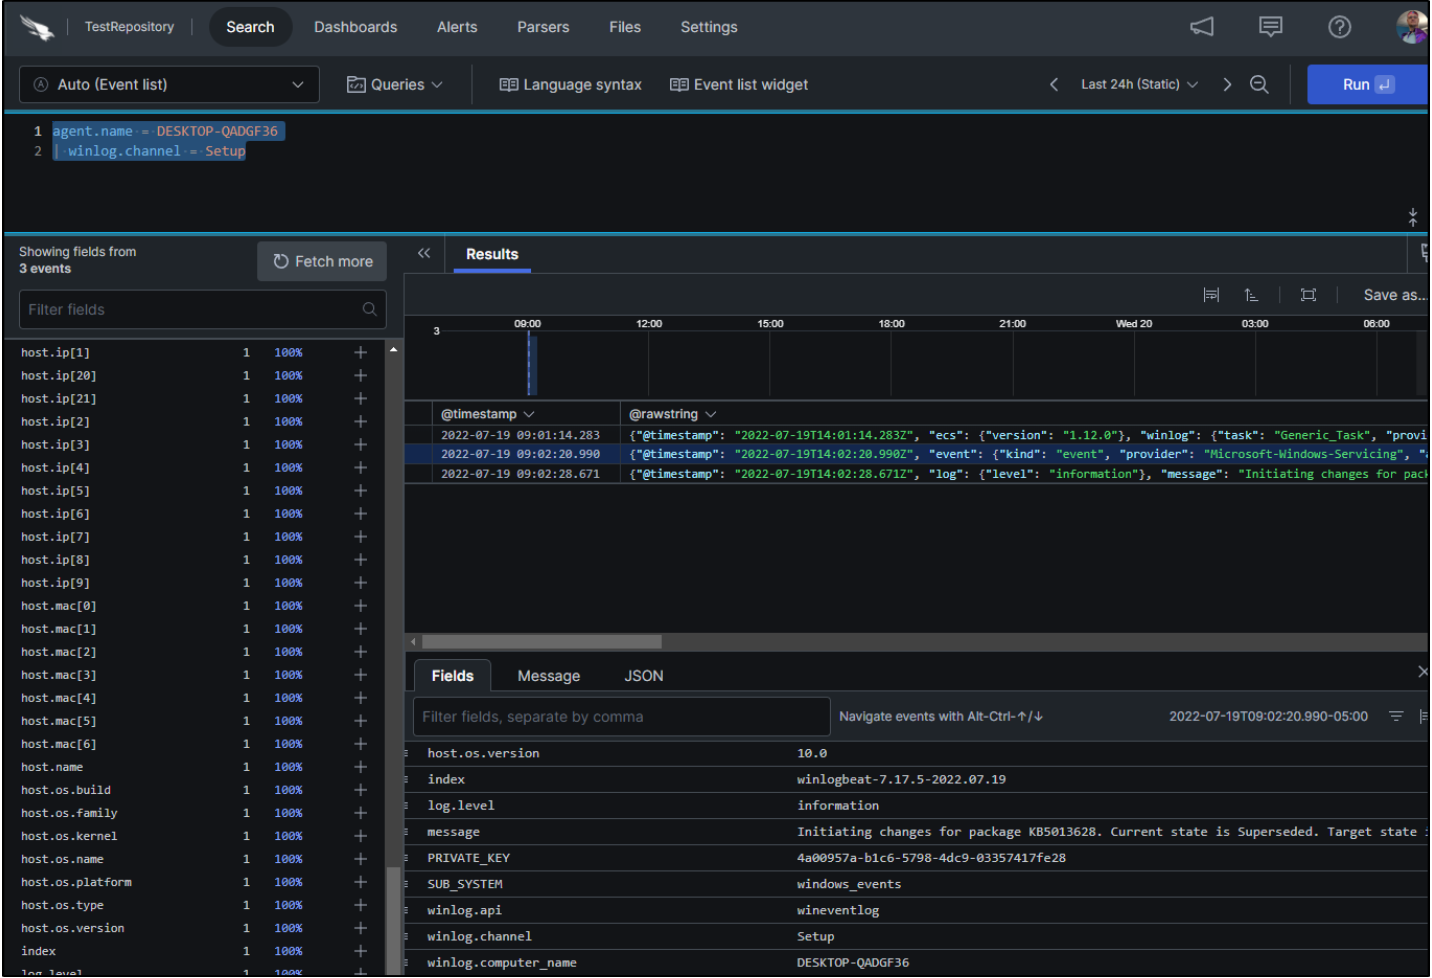
We see the same log event in our query results. It works!
Adding more logs
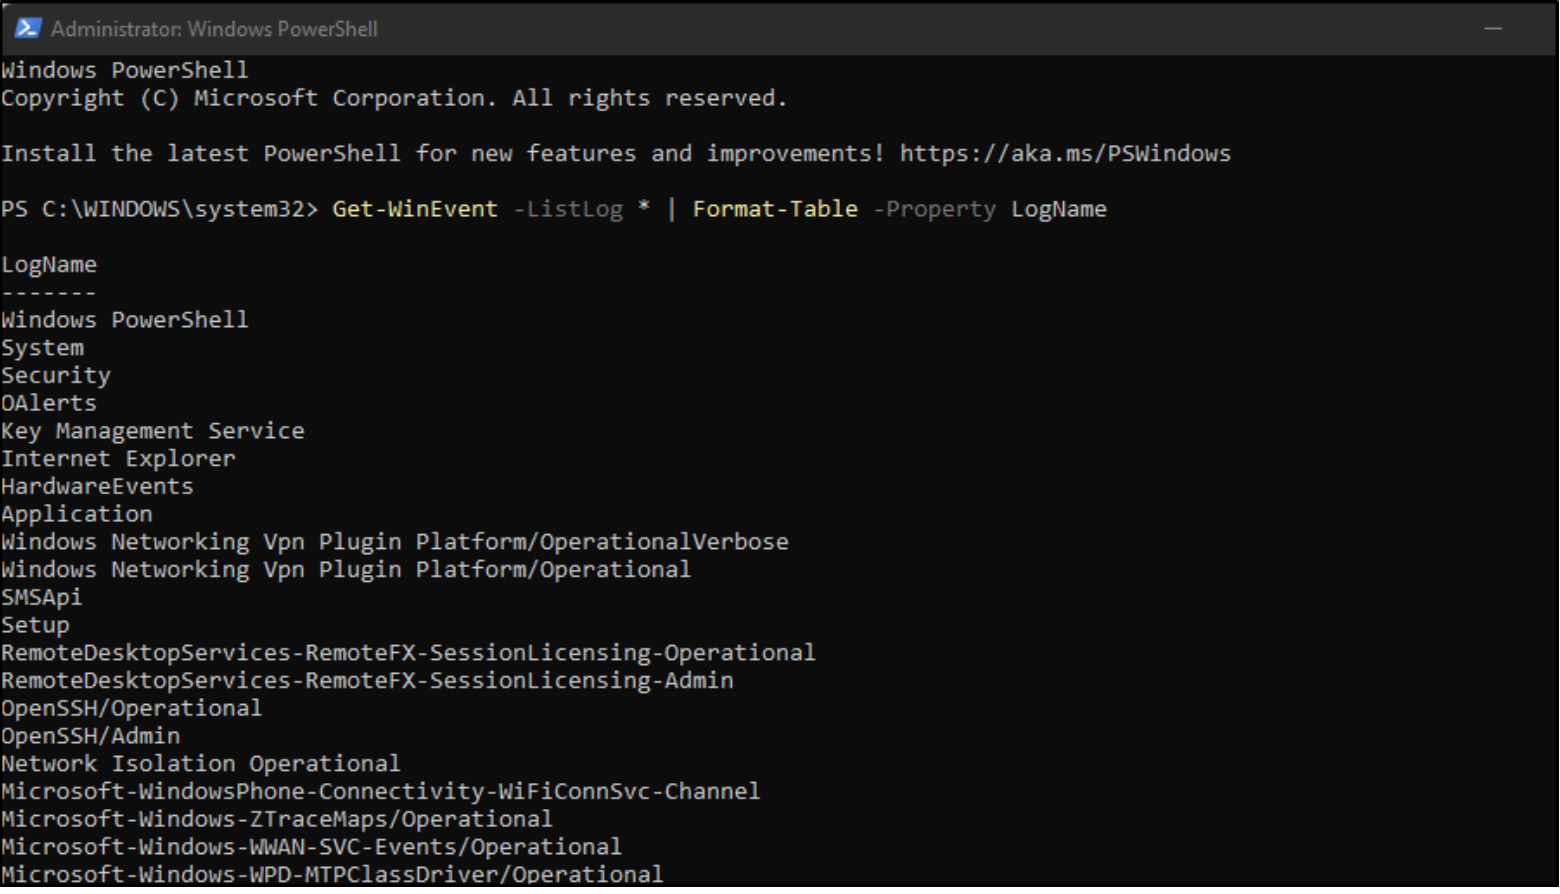
Windows has an extensive list of logs that we can add to Winlogbeat and ship to LogScale. We can see the full list by using the following command in a Powershell prompt as an administrator:
Get-WinEvent -ListLog * | Format-Table -Property LogName
Summary
In this how-to guide, we showed how easy it is to add Windows monitoring to LogScale by using the freely available Winlogbeat log shipper on your Windows hosts. We walked through these simple steps:
- Setting up an account and a repository with LogScale Community Edition
- Installing and configuring Winlogbeat (OSS version)
- Using LogScale queries to verify that Windows logs are being shipped correctly
- Adding other Windows logs beside the Winlogbeat defaults (application, system, and security events).
Happy logging!
Additional Resources
- Read why CrowdStrike Falcon Insight XDR is the next frontier for detection and response.
- See how CrowdStrike is driving the convergence of security and observability with Falcon LogScale and Falcon Complete LogScale.
- Watch a Falcon Insight XDR demo.
- Get a full-featured free trial of CrowdStrike Falcon Prevent™ and see for yourself how true next-gen AV performs against today’s most sophisticated threats.
- Contact us to learn more about Falcon Insight XDR and Falcon LogScale.