


![Helping Non-Security Stakeholders Understand ATT&CK in 10 Minutes or Less [VIDEO]](https://assets.crowdstrike.com/is/image/crowdstrikeinc/video-ATTCK2-1?wid=530&hei=349&fmt=png-alpha&qlt=95,0&resMode=sharp2&op_usm=3.0,0.3,2,0)
![Qatar’s Commercial Bank Chooses CrowdStrike Falcon®: A Partnership Based on Trust [VIDEO]](https://assets.crowdstrike.com/is/image/crowdstrikeinc/Edward-Gonam-Qatar-Blog2-1?wid=530&hei=349&fmt=png-alpha&qlt=95,0&resMode=sharp2&op_usm=3.0,0.3,2,0)


?wid=2048&hei=1350&fmt=png-alpha&qlt=95,0&resMode=sharp2&op_usm=3.0,0.3,2,0)


Virtually every aspect of a modern business depends on having a reliable, secure, real-time, high-quality data stream. So how do organizations design, build and maintain a data processing pipeline that delivers?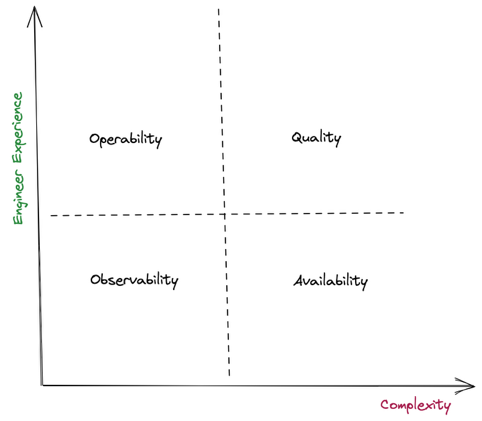 As illustrated above, we’re modeling these attributes along two axes — complexity of implementation and engineer experience — which enables us to classify these attributes into four quadrants.
In using this model, it is possible to consider the challenges involved in building a comprehensive monitoring system and the iterative approach engineers can take to realize benefits while advancing their monitoring strategy.
For example, in the lower left quadrant, we start with basic observability, which is relatively easy to address and is helpful in terms of creating a positive developer experience. As we move along the X axis and up the Y axis, measuring these attributes becomes challenging and might need a significant development effort.
In this post, we explore each of the four quadrants, starting with observability, which focuses on inferring the operational state of our data streaming infrastructure from the knowledge of external outputs. We will then explore availability and discuss how we make sure that the data keeps flowing end-to-end in our streaming data infrastructure systems without interruption. Next, we will discuss simple and repeatable processes to deal with the issues and the auto-remediations we created to help improve operability. Finally, we will explore how we improved efficiency of our processing pipelines and established some key indicators and some enforceable service level agreements (SLAs) for quality.
As illustrated above, we’re modeling these attributes along two axes — complexity of implementation and engineer experience — which enables us to classify these attributes into four quadrants.
In using this model, it is possible to consider the challenges involved in building a comprehensive monitoring system and the iterative approach engineers can take to realize benefits while advancing their monitoring strategy.
For example, in the lower left quadrant, we start with basic observability, which is relatively easy to address and is helpful in terms of creating a positive developer experience. As we move along the X axis and up the Y axis, measuring these attributes becomes challenging and might need a significant development effort.
In this post, we explore each of the four quadrants, starting with observability, which focuses on inferring the operational state of our data streaming infrastructure from the knowledge of external outputs. We will then explore availability and discuss how we make sure that the data keeps flowing end-to-end in our streaming data infrastructure systems without interruption. Next, we will discuss simple and repeatable processes to deal with the issues and the auto-remediations we created to help improve operability. Finally, we will explore how we improved efficiency of our processing pipelines and established some key indicators and some enforceable service level agreements (SLAs) for quality.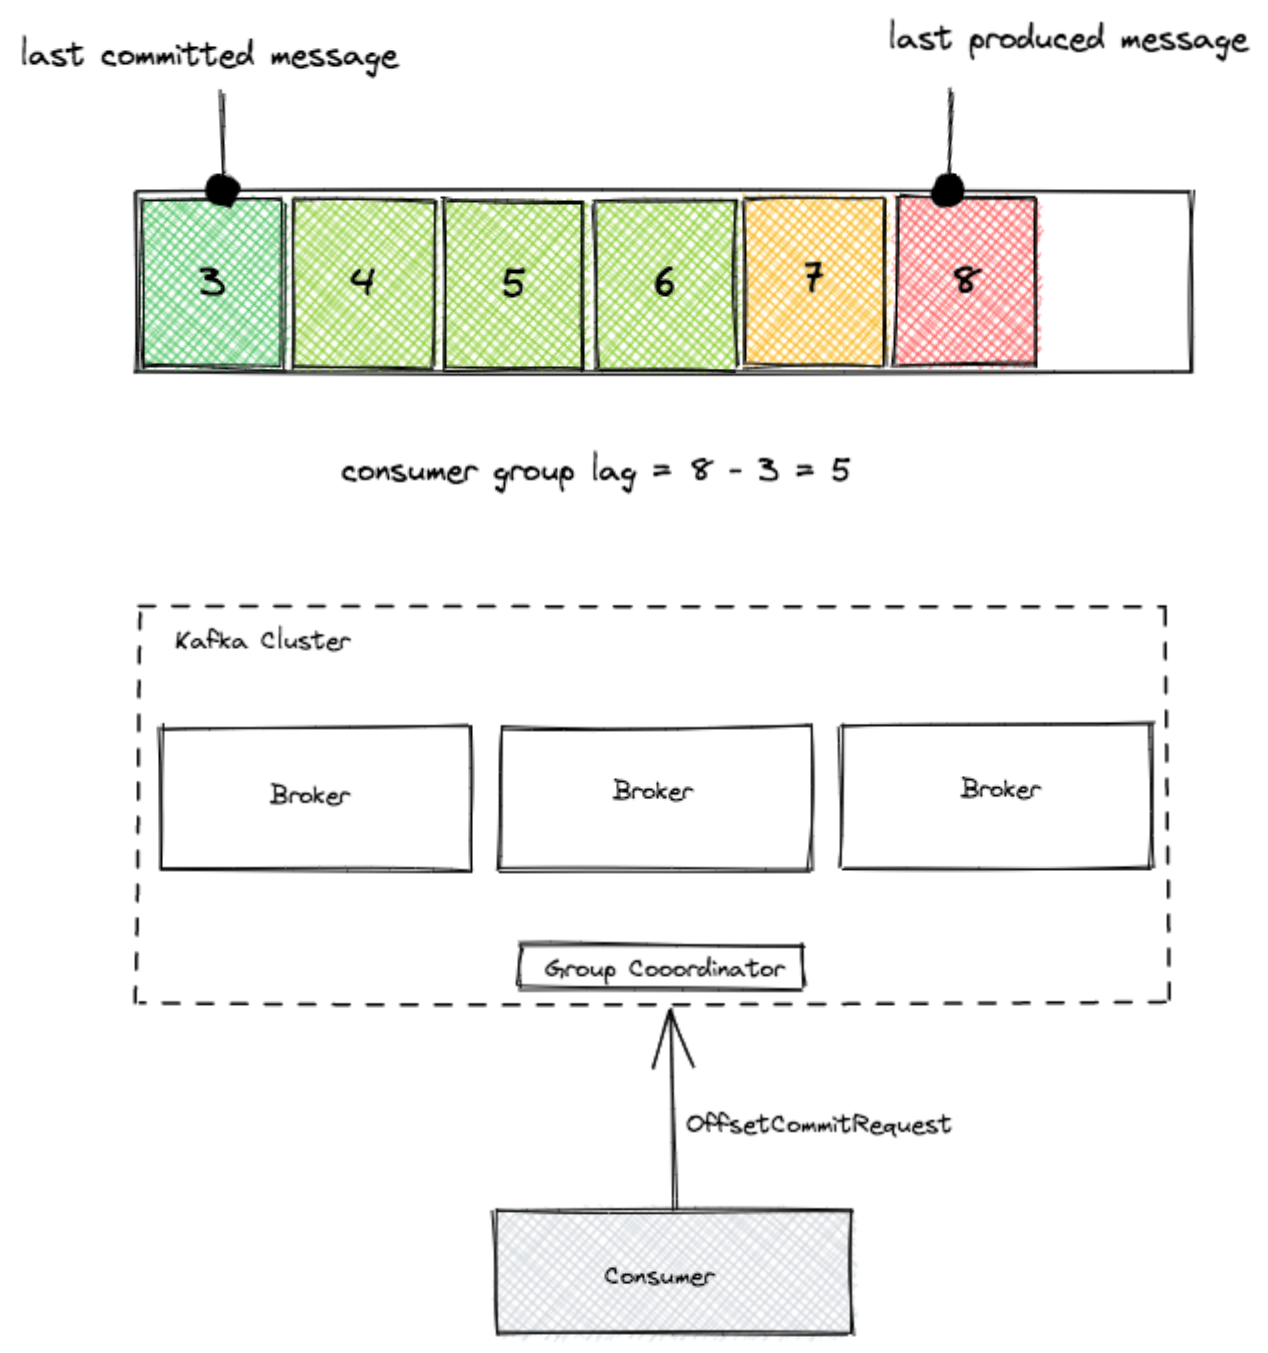 Therefore, lag is the delta between the last committed message to the last produced message. In other words, lag indicates how far behind your application is in processing up-to-date information. Also, Kafka persistence is based on retention, meaning that if your lag persists, you will lose data at some point in time. The goal is to keep lag to a minimum.
We use Burrow for monitoring Kafka consumer group lag. Burrow is an open source monitoring solution for Kafka that provides consumer lag checking as a service. It monitors committed offsets for all consumers and calculates the status of those consumers on demand. The metrics are exposed via an HTTP endpoint.
Therefore, lag is the delta between the last committed message to the last produced message. In other words, lag indicates how far behind your application is in processing up-to-date information. Also, Kafka persistence is based on retention, meaning that if your lag persists, you will lose data at some point in time. The goal is to keep lag to a minimum.
We use Burrow for monitoring Kafka consumer group lag. Burrow is an open source monitoring solution for Kafka that provides consumer lag checking as a service. It monitors committed offsets for all consumers and calculates the status of those consumers on demand. The metrics are exposed via an HTTP endpoint.
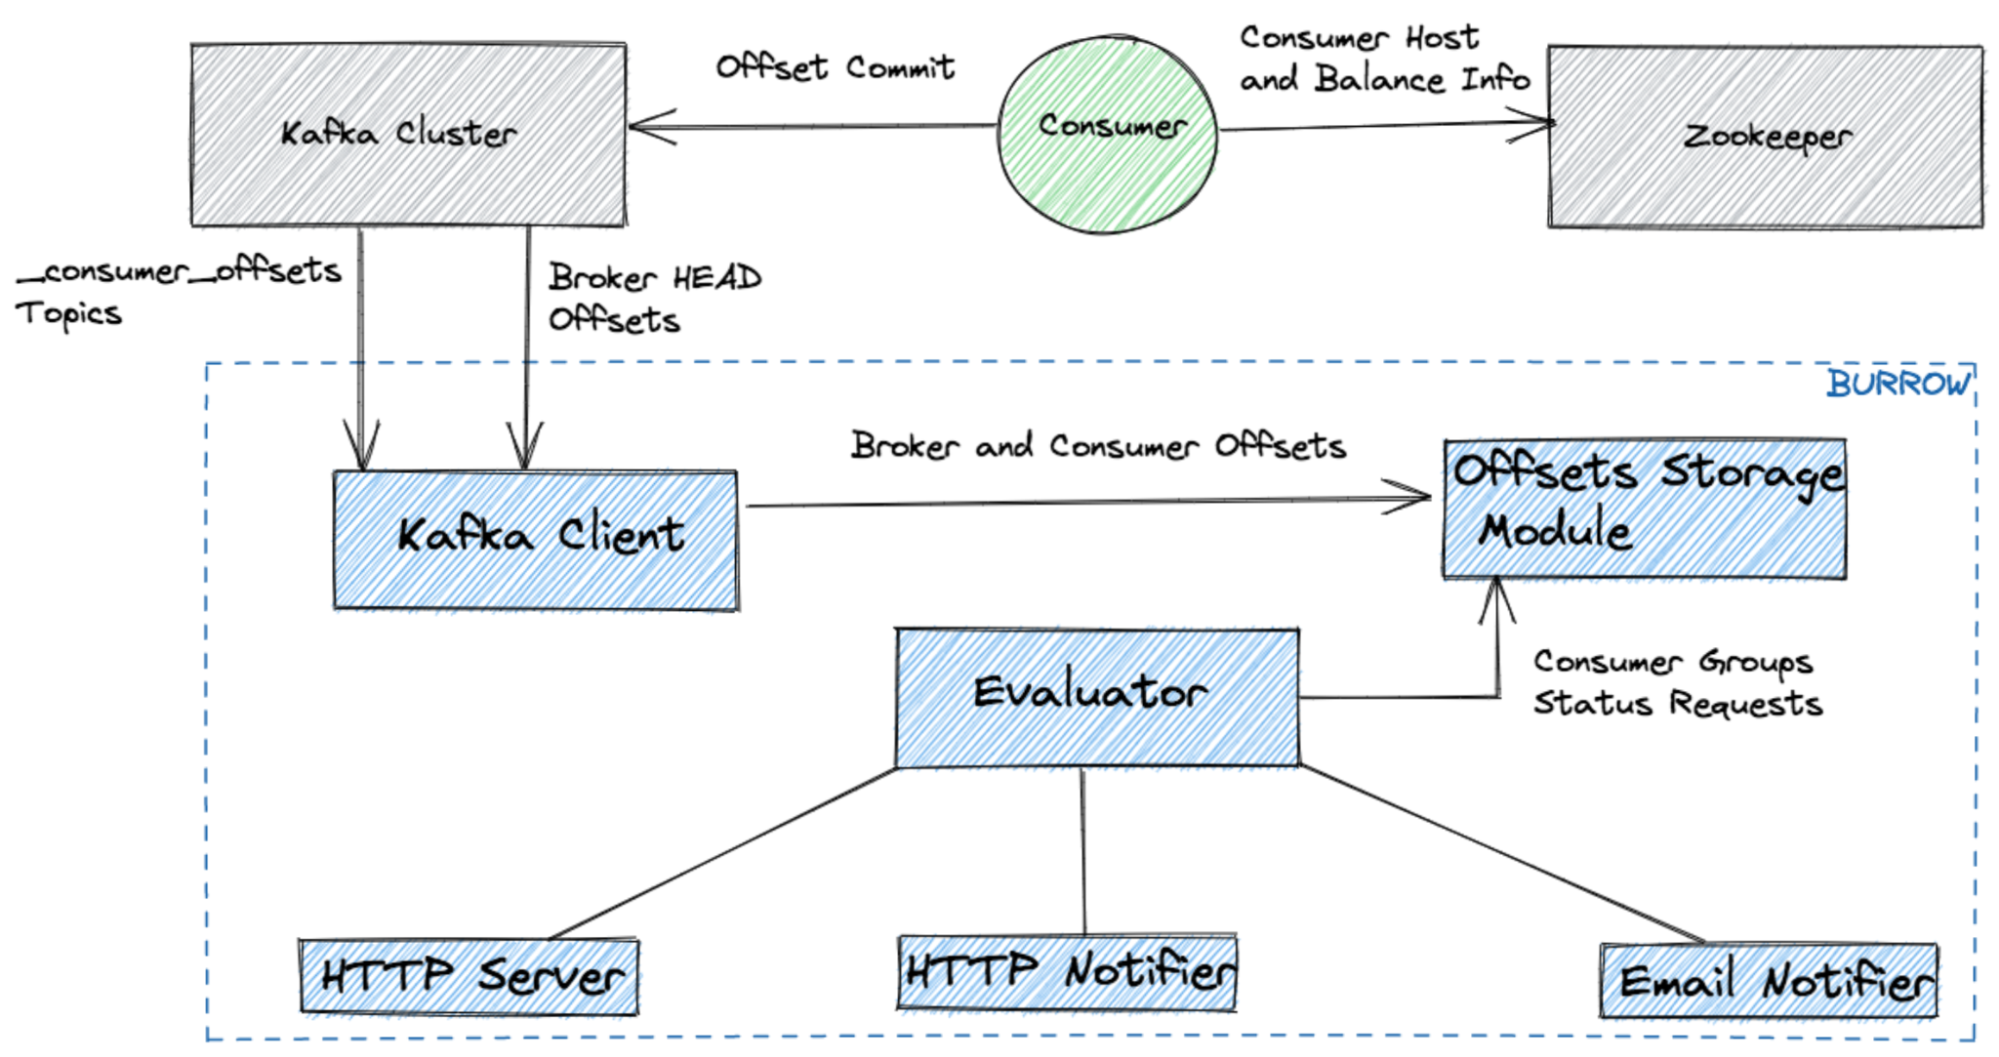 It also has configurable notifiers that can send status updates via email or HTTP if a partition status has changed based on predefined lag evaluation rules.
Burrow exposes both status and consumer group lag information in a structured format for a given consumer group across all of the partitions of the topic from which it is consuming. However, there is one drawback with this system: It will only present us with a snapshot of consumer group lag. Having the ability to look back in time and analyze historical trends in this data for a given consumer group is important for us.
It also has configurable notifiers that can send status updates via email or HTTP if a partition status has changed based on predefined lag evaluation rules.
Burrow exposes both status and consumer group lag information in a structured format for a given consumer group across all of the partitions of the topic from which it is consuming. However, there is one drawback with this system: It will only present us with a snapshot of consumer group lag. Having the ability to look back in time and analyze historical trends in this data for a given consumer group is important for us.
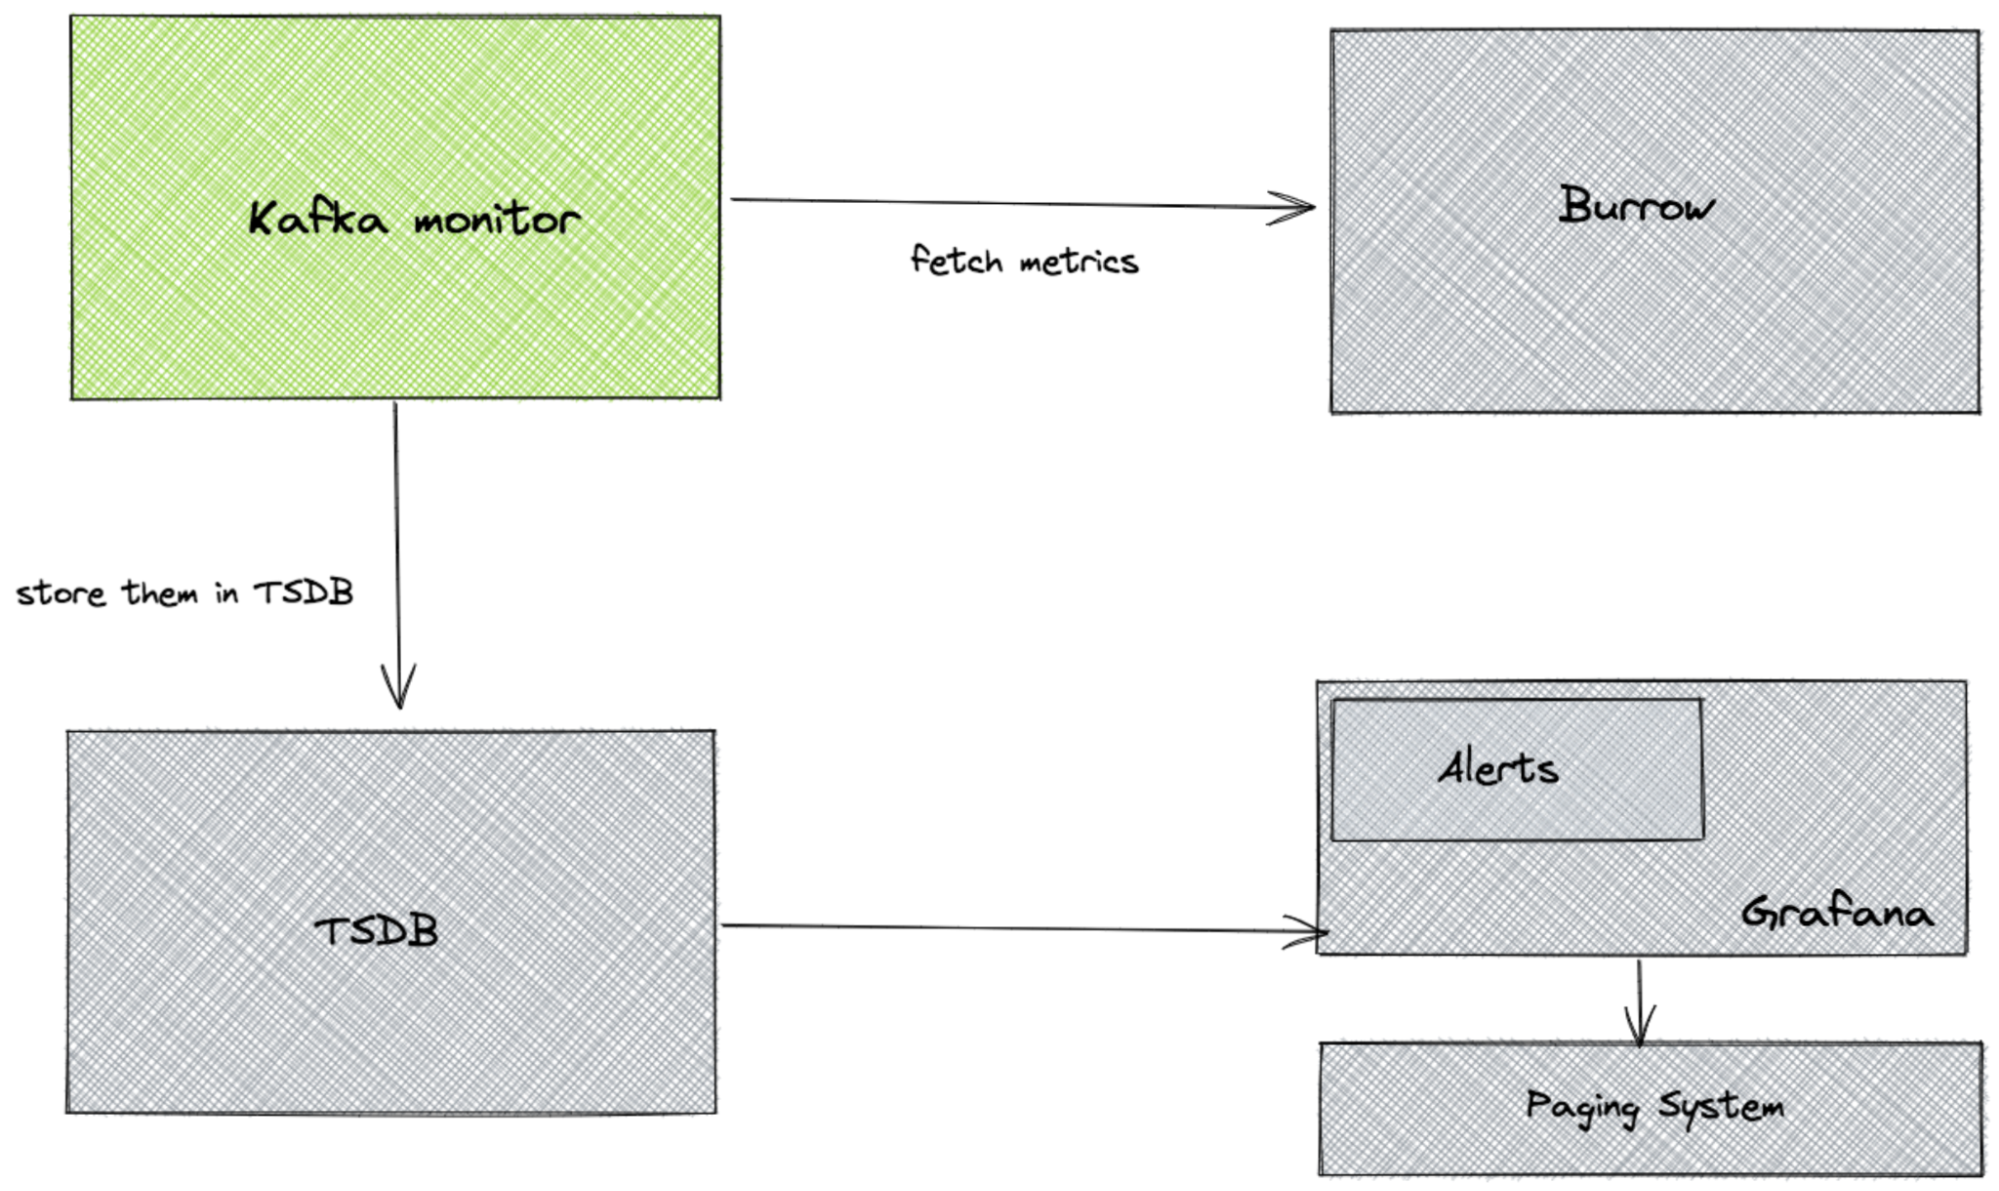 To address this, we built a system called Kafka monitor. Kafka monitor fetches these metrics that are exposed by Burrow and stores them in a time series database. This enabled us to analyze historical trends and even perform velocity calculations like mean recovery time from lag for a Kafka consumer, for example.
In the next section, we explore how we implemented auto-remediations, using the consumer group status information from Burrow, to improve the availability and operability in our data infrastructure.
To address this, we built a system called Kafka monitor. Kafka monitor fetches these metrics that are exposed by Burrow and stores them in a time series database. This enabled us to analyze historical trends and even perform velocity calculations like mean recovery time from lag for a Kafka consumer, for example.
In the next section, we explore how we implemented auto-remediations, using the consumer group status information from Burrow, to improve the availability and operability in our data infrastructure.
 Of course, we'll still investigate the root cause afterward. Also, when the relaunch does not fix the problem or if it fails to relaunch for some reason, AlertResponder will then escalate this to an on-call engineer by paging them.
The second useful automation that we derive from our consumer lag monitoring is streaming jobs autoscaling. For most of our streams, traffic fluctuates on a daily basis. It is very inefficient to use a fixed capacity for all streaming jobs. During the peak hours, after the traffic exceeds a certain threshold, the consumer lag will increase dramatically. The direct impact of this is that the customers will see increased processing delays and latency at peak hours.
This is where auto-scaling helps. We use two auto-scaling strategies:
Of course, we'll still investigate the root cause afterward. Also, when the relaunch does not fix the problem or if it fails to relaunch for some reason, AlertResponder will then escalate this to an on-call engineer by paging them.
The second useful automation that we derive from our consumer lag monitoring is streaming jobs autoscaling. For most of our streams, traffic fluctuates on a daily basis. It is very inefficient to use a fixed capacity for all streaming jobs. During the peak hours, after the traffic exceeds a certain threshold, the consumer lag will increase dramatically. The direct impact of this is that the customers will see increased processing delays and latency at peak hours.
This is where auto-scaling helps. We use two auto-scaling strategies:
 We deploy monitors that submit sample input data to the data pipeline and observe the outputs from the pipeline. These monitors submit end-to-end processing latency metrics that, combined with our alerting framework, will be used to emit SLA-based alerts.
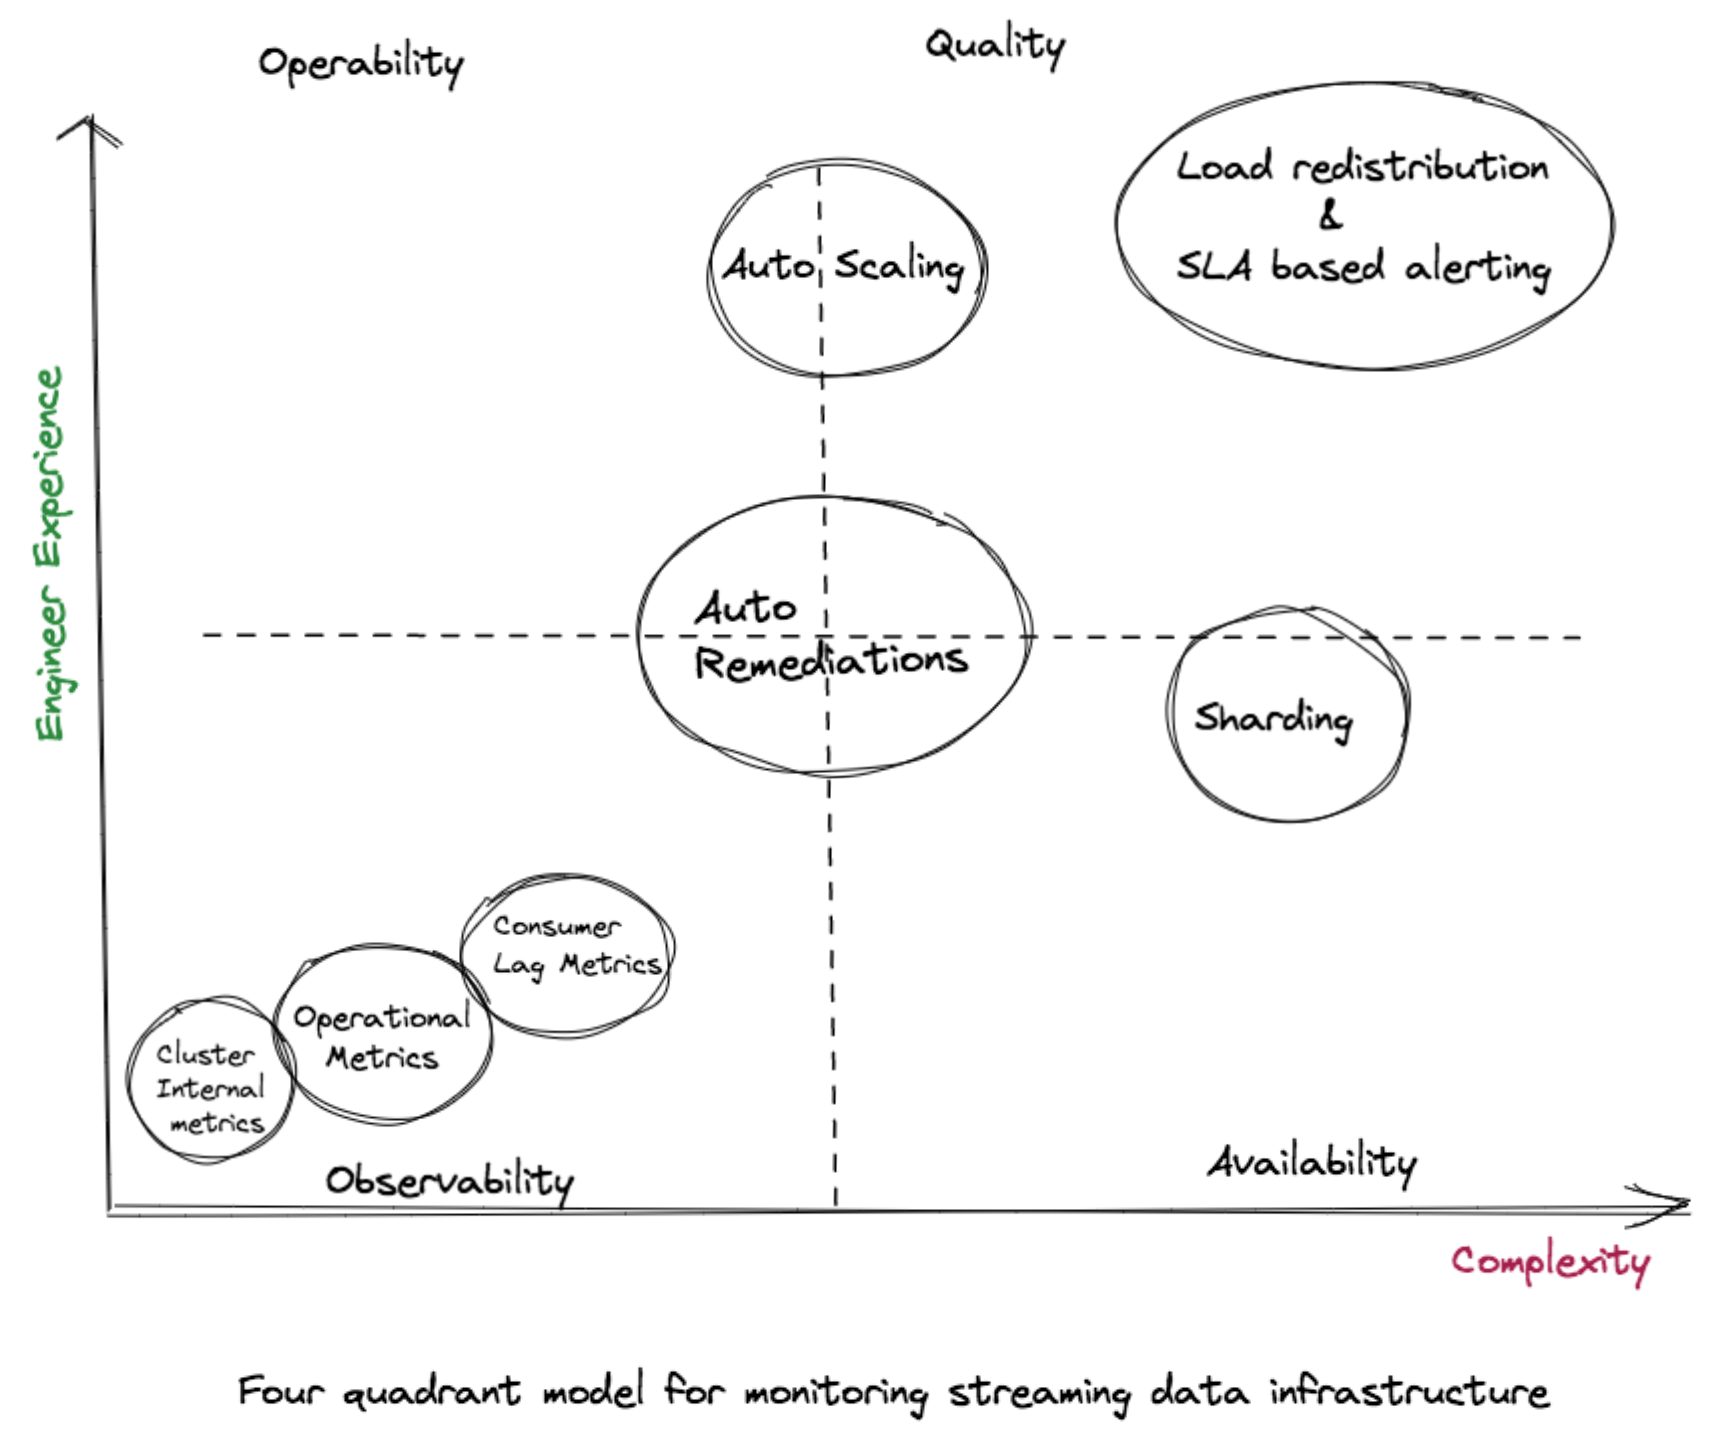 These four attributes — observability, availability, operability and quality — are each important in their own right for designing, working in and maintaining the streaming data infrastructure at scale. As discussed in our post, these attributes have a symbiotic relationship. The four-quadrant model not only exposes this relationship but also offers an intuitive mental model that helps us build a comprehensive monitoring solution for streaming data applications that operate at scale.
Have ideas to share about how you create a high-functioning data processing pipeline? Share your thoughts with @CrowdStrike via social media.
These four attributes — observability, availability, operability and quality — are each important in their own right for designing, working in and maintaining the streaming data infrastructure at scale. As discussed in our post, these attributes have a symbiotic relationship. The four-quadrant model not only exposes this relationship but also offers an intuitive mental model that helps us build a comprehensive monitoring solution for streaming data applications that operate at scale.
Have ideas to share about how you create a high-functioning data processing pipeline? Share your thoughts with @CrowdStrike via social media.
In creating a comprehensive monitoring strategy for CrowdStrike’s data processing pipelines, we found it helpful to consider four main attributes: observability, operability, availability and quality.
As illustrated above, we’re modeling these attributes along two axes — complexity of implementation and engineer experience — which enables us to classify these attributes into four quadrants.
In using this model, it is possible to consider the challenges involved in building a comprehensive monitoring system and the iterative approach engineers can take to realize benefits while advancing their monitoring strategy.
For example, in the lower left quadrant, we start with basic observability, which is relatively easy to address and is helpful in terms of creating a positive developer experience. As we move along the X axis and up the Y axis, measuring these attributes becomes challenging and might need a significant development effort.
In this post, we explore each of the four quadrants, starting with observability, which focuses on inferring the operational state of our data streaming infrastructure from the knowledge of external outputs. We will then explore availability and discuss how we make sure that the data keeps flowing end-to-end in our streaming data infrastructure systems without interruption. Next, we will discuss simple and repeatable processes to deal with the issues and the auto-remediations we created to help improve operability. Finally, we will explore how we improved efficiency of our processing pipelines and established some key indicators and some enforceable service level agreements (SLAs) for quality.
Observability
Apache Kafka is a distributed, replicated messaging service platform that serves as a highly scalable, reliable and fast data ingestion and streaming tool. At CrowdStrike, we use Apache Kafka as the main component of our near real-time data processing systems to handle over a trillion events per day.Ensuring Kafka Cluster Is Operational
When we create a new Kafka cluster, we must establish that it is reachable and operational. We can check that using a simple external service that constantly sends heartbeat messages to the Kafka cluster, and at the same time, consumes those messages. We can make sure that the messages that it produces matches the messages it has consumed. By doing that, we have gained confidence that the Kafka cluster is truly operational. Once we establish that the cluster is operational, we check on other key metrics, such as the consumer group lag.
Kafka Lag Monitoring
One of the key metrics to monitor when working with Kafka, as a data pipeline or a streaming platform, is consumer group lag. When an application consumes messages from Kafka, it commits its offset in order to keep its position in the partition. When a consumer gets stuck for any reason — for example, an error, rebalance or even a complete stop — it can resume from the last committed offset and continue from the same point in time.
Therefore, lag is the delta between the last committed message to the last produced message. In other words, lag indicates how far behind your application is in processing up-to-date information. Also, Kafka persistence is based on retention, meaning that if your lag persists, you will lose data at some point in time. The goal is to keep lag to a minimum.
We use Burrow for monitoring Kafka consumer group lag. Burrow is an open source monitoring solution for Kafka that provides consumer lag checking as a service. It monitors committed offsets for all consumers and calculates the status of those consumers on demand. The metrics are exposed via an HTTP endpoint.
It also has configurable notifiers that can send status updates via email or HTTP if a partition status has changed based on predefined lag evaluation rules.
Burrow exposes both status and consumer group lag information in a structured format for a given consumer group across all of the partitions of the topic from which it is consuming. However, there is one drawback with this system: It will only present us with a snapshot of consumer group lag. Having the ability to look back in time and analyze historical trends in this data for a given consumer group is important for us.
To address this, we built a system called Kafka monitor. Kafka monitor fetches these metrics that are exposed by Burrow and stores them in a time series database. This enabled us to analyze historical trends and even perform velocity calculations like mean recovery time from lag for a Kafka consumer, for example.
In the next section, we explore how we implemented auto-remediations, using the consumer group status information from Burrow, to improve the availability and operability in our data infrastructure.
Availability and Operability
Kafka Cluster High Availability
Initially, our organization relied on one very large cluster in Kafka to process incoming events. Over time, we expanded that cluster to manage our truly enormous data stream.
However, as our company continues to grow, scaling our clusters vertically has become both problematic and impractical. Our recent blog post, Sharding Kafka for Increased Scale and Reliability, explores this issue and our solution in greater detail.
Improved Availability and Operability for Stream Processing Jobs
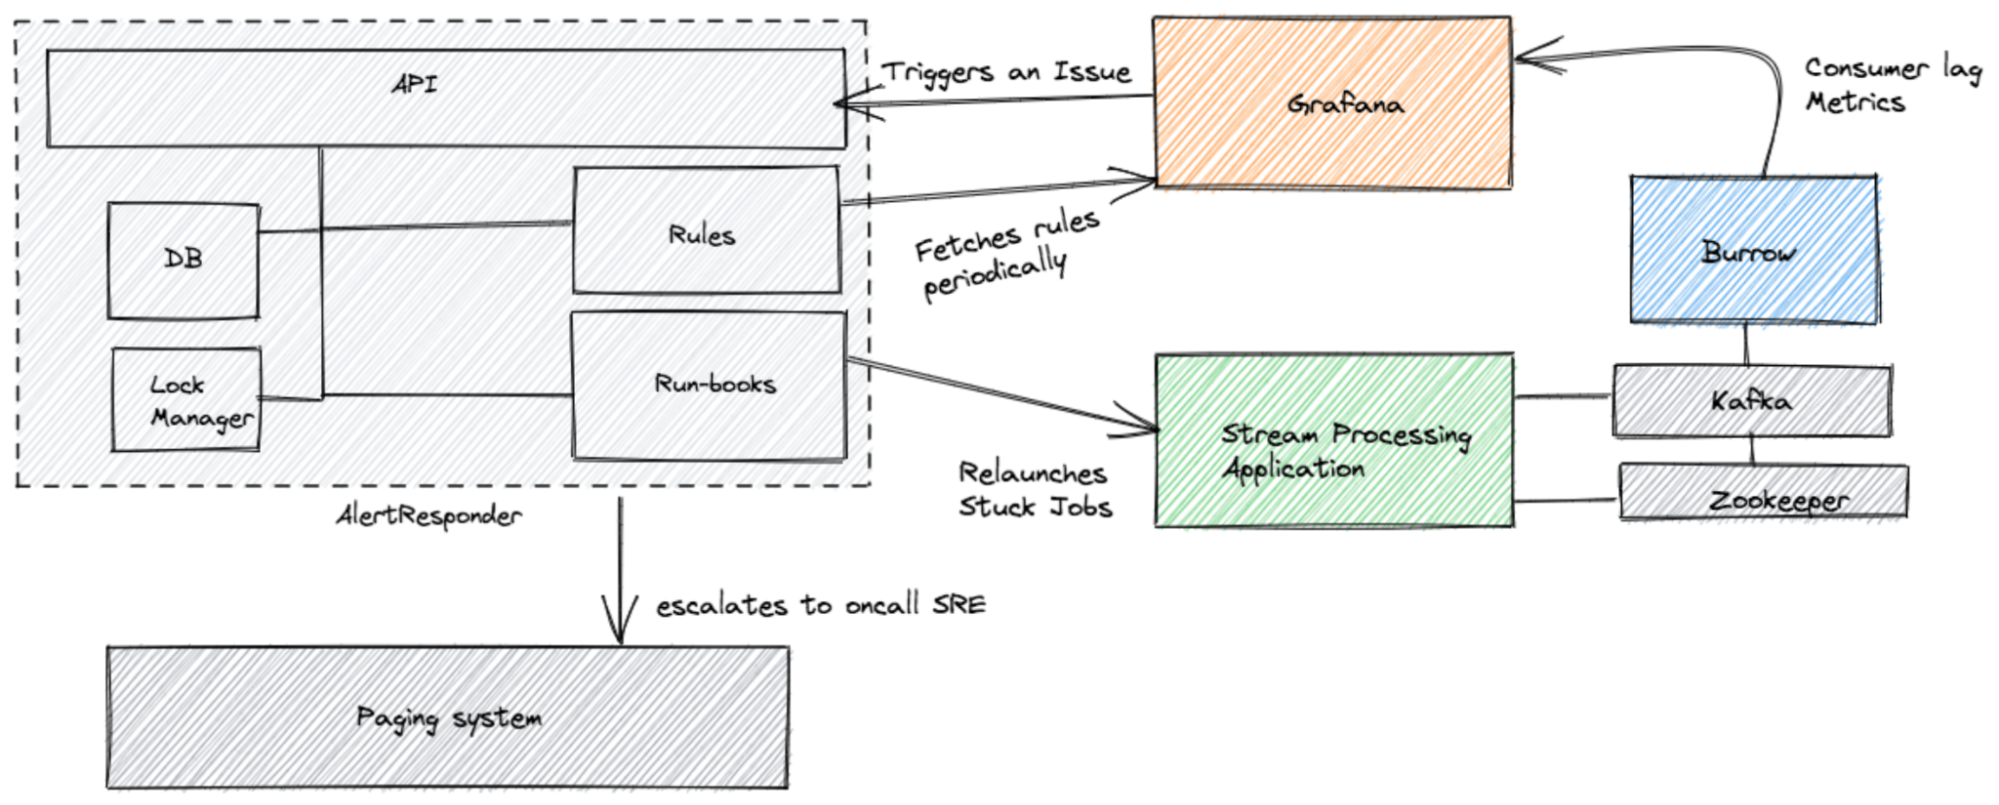
For our stateless streaming jobs, we noticed that by simply relaunching these jobs upon getting stuck, we have a good chance of getting that consumer out of the stuck state. However, it is not practical at our scale to relaunch these jobs manually. So we created a tool called AlertResponder. As the name implies, it will automatically relaunch a stateless job upon getting the first consumer stuck alert.
Of course, we'll still investigate the root cause afterward. Also, when the relaunch does not fix the problem or if it fails to relaunch for some reason, AlertResponder will then escalate this to an on-call engineer by paging them.
The second useful automation that we derive from our consumer lag monitoring is streaming jobs autoscaling. For most of our streams, traffic fluctuates on a daily basis. It is very inefficient to use a fixed capacity for all streaming jobs. During the peak hours, after the traffic exceeds a certain threshold, the consumer lag will increase dramatically. The direct impact of this is that the customers will see increased processing delays and latency at peak hours.
This is where auto-scaling helps. We use two auto-scaling strategies:
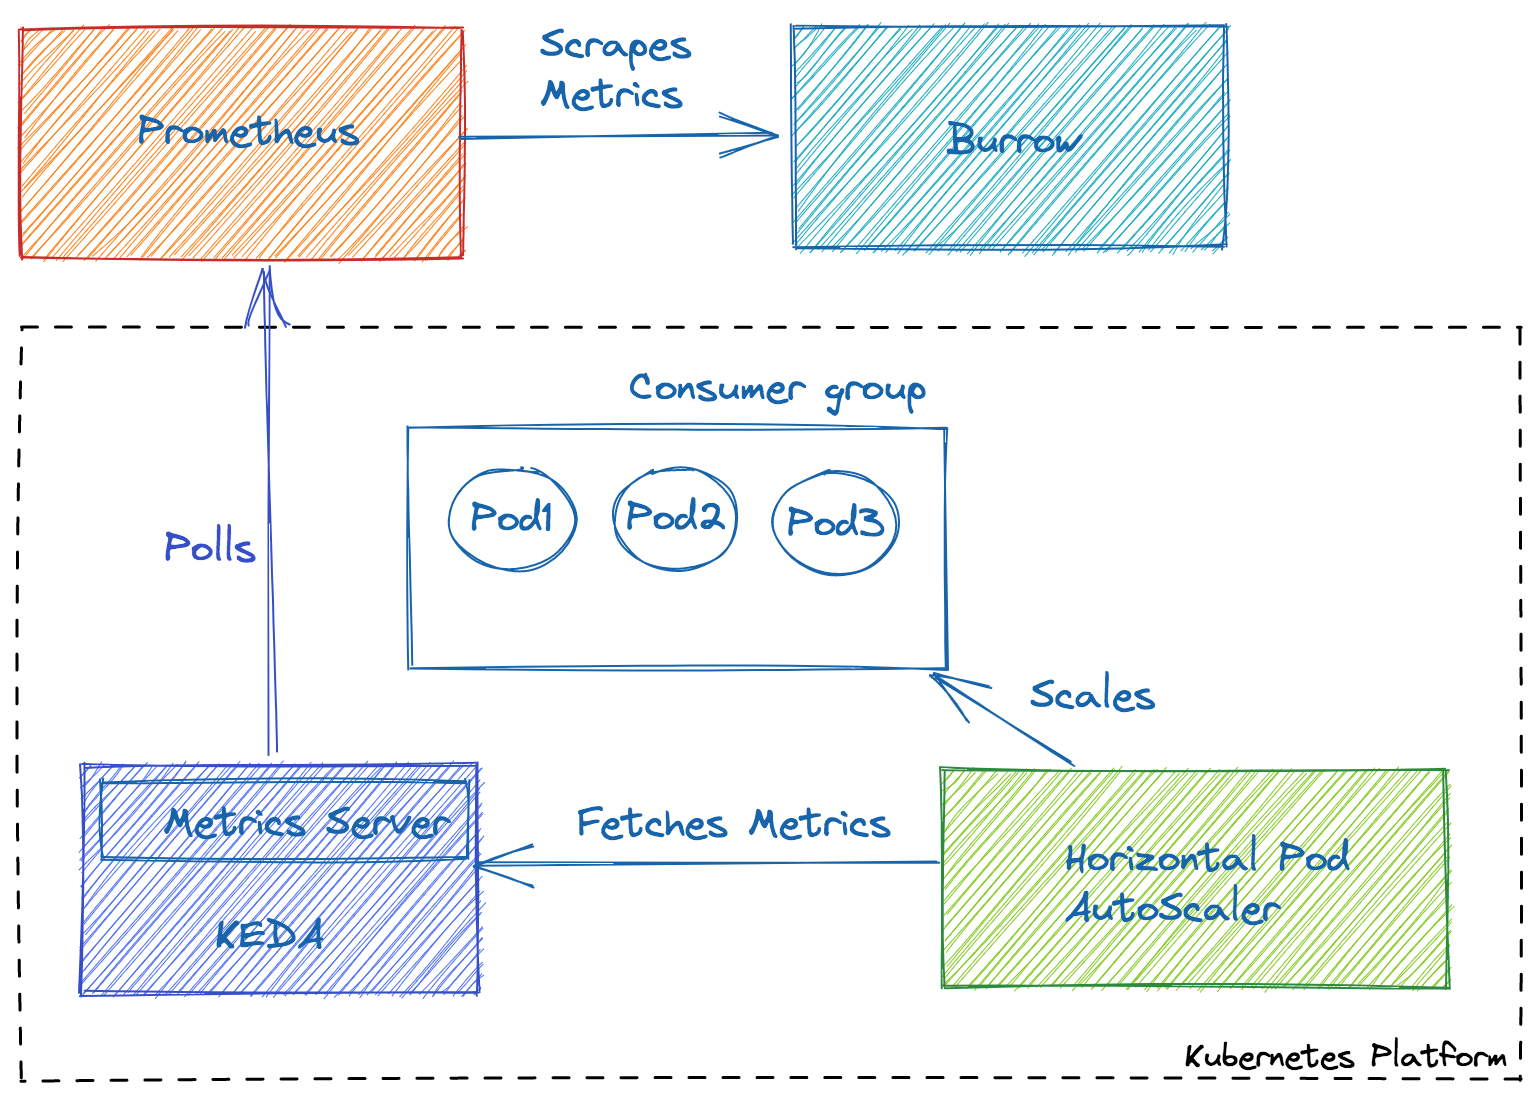
- Scheduled scaling: For stream processing jobs for which we are able to reliably predict the traffic patterns over the course of a day, we implemented a scheduled auto scaling strategy. With this strategy, we scale the consumer groups to a predetermined capacity at a known point in time to match the traffic patterns.
- Scaling based on consumer lag: For jobs running on our Kubernetes platform, we use KEDA (Kubernetes-based Event Driven Autoscaler) to scale the consumer groups. With KEDA, you can drive the scaling of any container in Kubernetes based on the number of events needing to be processed. We use KEDA’s Prometheus scaler. Using the consumer lag metrics that are available in prometheus, KEDA calculates the number of containers needed for the streaming jobs and works with HPA to scale a deployment accordingly.
Quality
When we talk about the quality of streaming data infrastructure, we are essentially considering two things:
- Efficiency
- Conformance to service level agreements (SLAs)
Improving Efficiency Through Redistribution
When lag is uniform across a topic’s partitions, that is typically addressed by horizontal scaling of consumers as discussed above; however, when lag is not evenly distributed across a topic, scaling is much less effective. Unfortunately, there is no out-of-the box way to address the issue of lag hotspots on certain partitions of a topic within Kafka. In our recent post, Addressing Uneven Partition Lag in Kafka, we explore our solution and how we can coordinate it across our complex ecosystem of more than 300 microservices.
SLA-based Monitoring
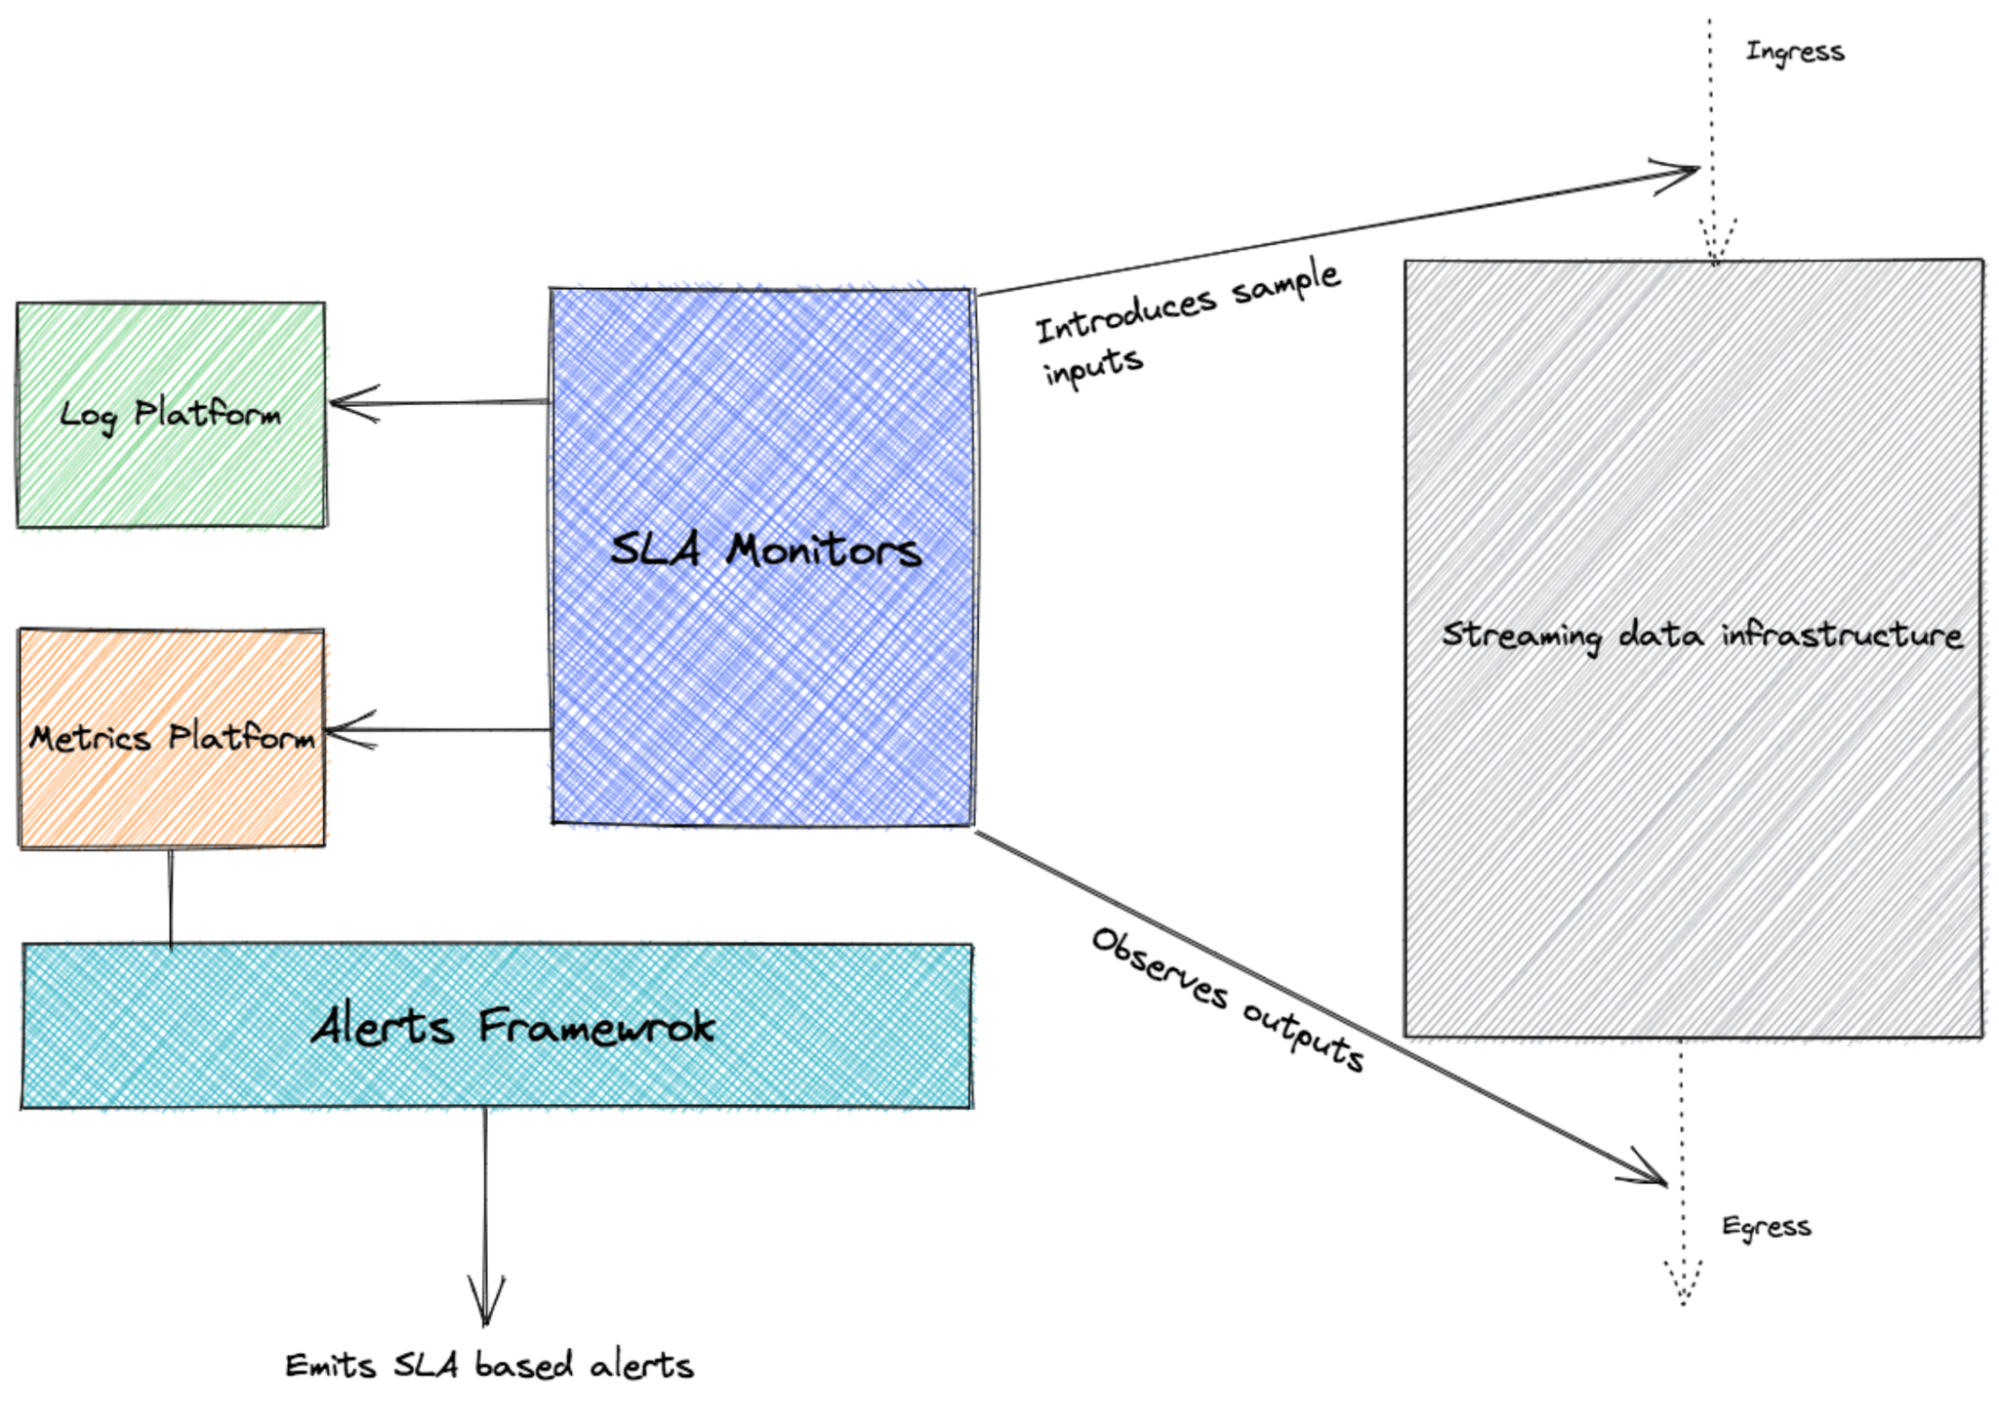
It is almost impossible to measure the quality of a service correctly, let alone well, without understanding which behaviors really matter for that service and how to measure and evaluate those behaviors. Service level indicators (SLIs), like data loss rate and end-to-end latency, are useful to measure the quality of our streaming data infrastructure.As an example, the diagram below shows how we track end-to-end latency through external observation (black box analysis).
We deploy monitors that submit sample input data to the data pipeline and observe the outputs from the pipeline. These monitors submit end-to-end processing latency metrics that, combined with our alerting framework, will be used to emit SLA-based alerts.
Conclusion
These four attributes — observability, availability, operability and quality — are each important in their own right for designing, working in and maintaining the streaming data infrastructure at scale. As discussed in our post, these attributes have a symbiotic relationship. The four-quadrant model not only exposes this relationship but also offers an intuitive mental model that helps us build a comprehensive monitoring solution for streaming data applications that operate at scale.
Have ideas to share about how you create a high-functioning data processing pipeline? Share your thoughts with @CrowdStrike via social media.


