


![Helping Non-Security Stakeholders Understand ATT&CK in 10 Minutes or Less [VIDEO]](https://assets.crowdstrike.com/is/image/crowdstrikeinc/video-ATTCK2-1?wid=530&hei=349&fmt=png-alpha&qlt=95,0&resMode=sharp2&op_usm=3.0,0.3,2,0)
![Qatar’s Commercial Bank Chooses CrowdStrike Falcon®: A Partnership Based on Trust [VIDEO]](https://assets.crowdstrike.com/is/image/crowdstrikeinc/Edward-Gonam-Qatar-Blog2-1?wid=530&hei=349&fmt=png-alpha&qlt=95,0&resMode=sharp2&op_usm=3.0,0.3,2,0)


?wid=2048&hei=1350&fmt=png-alpha&qlt=95,0&resMode=sharp2&op_usm=3.0,0.3,2,0)


One useful method in a security researcher’s toolbox for discovering new bugs in software is called “fuzz testing,” or just “fuzzing.” Fuzzing is an automatic software testing approach where the software that is to be tested (the target) is automatically fed with input data and its behavior during execution is analyzed and checked for any errors. For the CrowdStrike Intelligence Advanced Research Team, fuzzing is one of our crucial tools to perform bug hunting.
In fuzzing, a fuzzing engine generates suitable inputs, passes them to the target and monitors its execution. The goal is to find an input where the target behaves undesirably. This is, for example, a crash (e.g., Segmentation Fault). Figure 1 shows the main steps of a fuzzing run.
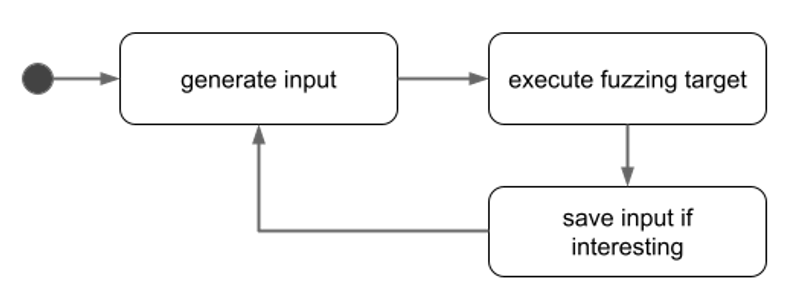 Figure 1. Steps a fuzzing engine performs during execution
Some of the most popular fuzzing engines are American Fuzzy Lop (AFL) and its successor AFL++; libFuzzer; and Honggfuzz. They are known not only to be very efficient in fuzzing but also to have a remarkable trophy case to show.
Figure 1. Steps a fuzzing engine performs during execution
Some of the most popular fuzzing engines are American Fuzzy Lop (AFL) and its successor AFL++; libFuzzer; and Honggfuzz. They are known not only to be very efficient in fuzzing but also to have a remarkable trophy case to show.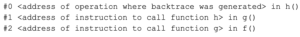 In summary, by executing the binary once on each sample,
 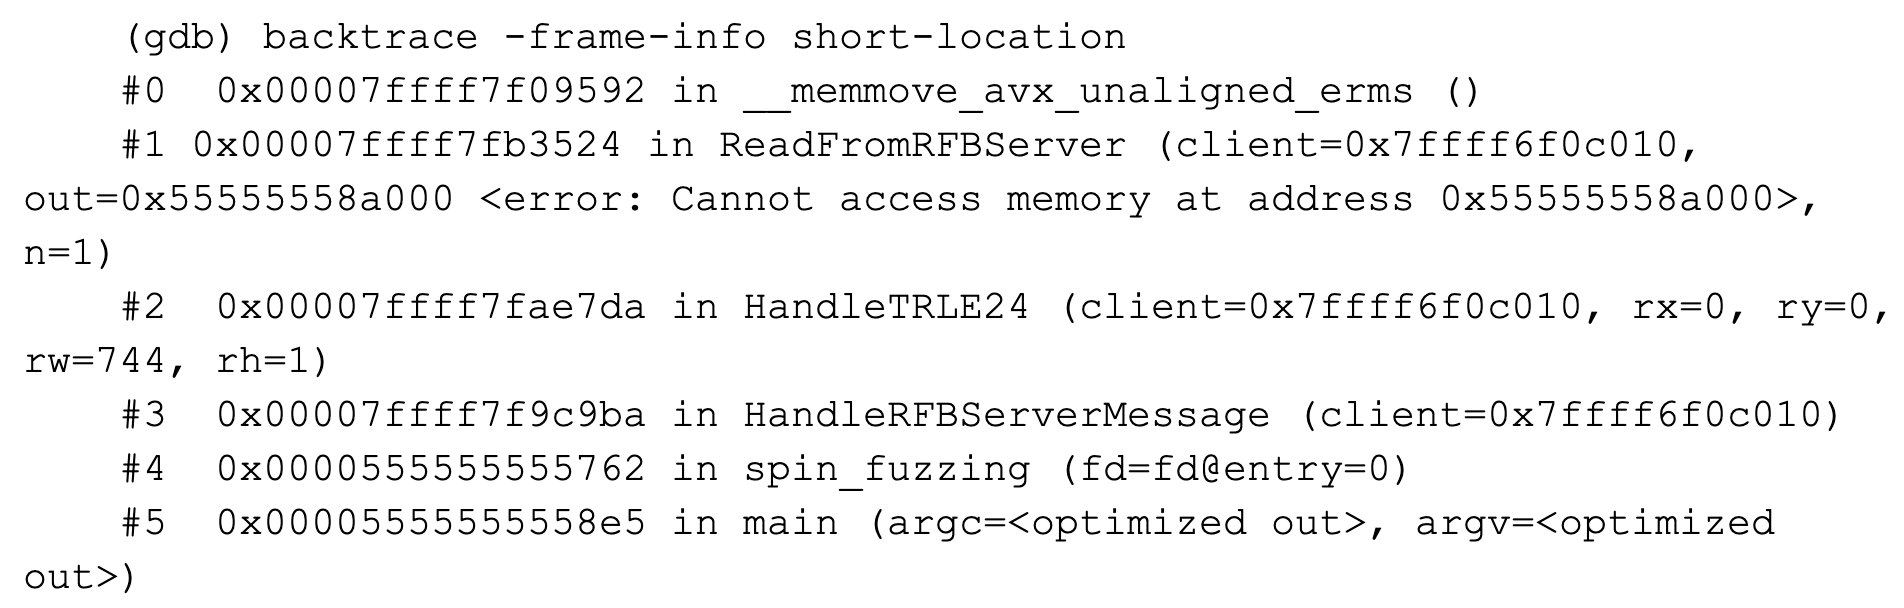 This information is then parsed, stored in a database and subsequently used to cluster all of the samples in order to reduce the overhead of identifying interesting bugs.
Figure 1. Steps a fuzzing engine performs during executionFuzzing can be quite successful because of its minimal overhead compared to other dynamic testing methods — in both compilation and preparation, and also in execution. It typically requires only lightweight instrumentation (e.g., a fixed number of instructions per basic block), and can therefore achieve close to native execution speed. One important disadvantage to consider is that the fuzzing engine usually tests only a fraction of all possible inputs, and bugs may remain undetected. Automatically generating inputs that trigger some kind of a bug in a reasonable amount of time is therefore one of the main challenges of fuzzing. On one hand, the number of inputs of a certain length is typically very large. On the other hand, testing all possible inputs is usually not necessary or even desirable, especially if the data must follow a certain format to actually reach relevant code paths.
One simple example is a target that considers an input to be valid if and only if it starts with a hard-coded string, aka a magic string. Therefore, many fuzzing engines expect a small set of valid inputs and then start deriving new inputs with different mutation strategies (e.g., flipping bits, or adding and removing arbitrary data). For some engines, this mutation is driven by instrumenting the target to measure the execution path that a certain input has triggered. The general assumption is that a change in the input that triggers a new execution path is more likely to discover crashes than a change that exercises a code path that was previously observed. During fuzzing, inputs that crash or hang the fuzzing target indicate that a bug was triggered. Such inputs (or samples) are collected for further analysis. Provided the target behaves deterministically, any input can be easily passed to the target again to try to reproduce the result observed during fuzzing. It is common for a fuzzing run to generate many samples that trigger the same bug in the target. For example, an input of 160 characters might trigger the same buffer overflow in the target as an input with 162 characters. To be able to handle the many potential samples generated during a fuzzing run and not have to analyze each individually, good tooling is crucial to triage them. While some targets require custom tooling, we found several strategies to be generally applicable, and we will introduce a few of them next.
Fuzzing
Instrumentation
Modern fuzzing approaches mutate those inputs that have shown particular promise of leading to new behavior. For example, coverage-guided fuzzing engines preferentially mutate those inputs that lead to undiscovered execution paths within the target. To be able to detect new execution paths, the fuzzing engine tries to measure the code coverage of a specific execution run. To do so, instrumentation is usually compiled into the target.The fuzzing tools usually provide their own compilation toolchains as a wrapper around common compilers (e.g.,
gcc or clang) to inject instrumentation at compile time. It should be noted that some fuzzing engines are also capable of fuzzing non-instrumented binaries — one popular method for fuzzing closed-source binaries is to use QEMU’s dynamic binary translation to transparently instrument them without recompilation. For the rest of this blog post, though, we’ll assume that we have access to the source code of a software and are allowed and able to modify and compile it.
Hunting for security vulnerabilities is important for estimating potential risks and exploitability of a software. However, only some types of vulnerabilities can be covered by a generic fuzzing engine. While a null pointer dereference would normally result in a crash of the fuzzing target and thus a report from the fuzzing engine, a logic flaw where a function returns a type-correct but wrong result is likely to go undetected.AFL++ and Honggfuzz, for example, report those inputs where the execution of the fuzzing target was terminated with a signal (e.g.,
SIGSEGV or SIGABRT). A generic fuzzing engine has no information whether a function such as int isdigit(int c) was correct when 1 is returned for a given character c. In addition, not every memory issue leads to a crash. Except access violations, an out-of-bound read operation might not be detected at all, and an out-of-bound write operation may cause the fuzzing target to crash if and only if the data that was overwritten is subsequently used in some way (e.g., a return address on the stack or an allocated heap memory segment).
There are two general solutions to address these issues. For one, Address Sanitizer (ASan) can be used to find and report memory errors that would not normally cause a program to crash. ASan, if specified via the environment setting ASAN_OPTIONS=”abort_on_error=1”, terminates a program with signal SIGABRT if an error is detected. In addition, small function wrappers can be implemented to introduce application-specific checks or other optimizations, as shown next.
The Harness
Fuzzing a library or a program typically requires researchers to write a bit of wrapper code that implements an entry point for the fuzzer, potentially executes some setup code, and passes the fuzzing input to the function that is to be fuzzed. This wrapper code is typically called a harness. In addition to passing along the fuzzer input, a harness can also provide several other features. First, a harness can normalize the input from the fuzzer to the target. Especially when targeting a function, wrapping it into an executable that presents a standardized interface to the fuzzing engine is necessary. This type of wrapper sometimes needs to do more than simply passing the input to the target function, because fuzzing engines in general would not be aware of any requirements or format that the target expects. For example, when targeting a function such asint some_api(char *data, size_t data_length);
which expects a string and the length of this string as arguments, a wrapper such as the following can be used to make sure that the data generated by the fuzzing engine is passed to the function in the proper format:
int fuzz_some_api(char *fuzz_data)
    {
        return some_api(fuzz_data, strlen(fuzz_data));
}For example, having a target function
char *encode(char *data) that is known to safely crash if the input string contains certain characters, a wrapper such as the following could be used to avoid such false positive reports:
char *fuzz_encode(char *fuzz_data)
    {
        for (char *ptr = fuzz_data; *ptr != NULL; ptr++)
            if (!fuzz_is_allowed_character(*ptr))
                return NULL;

        return encode(fuzz_data);
}char *encode(char *data);char *decode(char *data);
decode() is expected to implement the reverse function of encode(), and vice versa) a wrapper function can ensure that for any generated input, the string returned by decode(encode(fuzz_data)) is equal to the input fuzz_data. The wrapper function, and entry point for the fuzzer, might implement a routine as follows:
void fuzz_functions(char *fuzz_data)
    {
        if (strcmp(decode(encode(fuzz_data)), fuzz_data) != 0)
            trigger_crash(); // force a crash, e.g. via *((int *) 0) = -1;
}#ifdef statements as shown below:
int main(int argc, char **argv)
    {
    #ifdef FUZZING
        return func(get_fuzz_data());
    #endif
        // original codebase:
        data = get_data_via_options(argc, argv);
        return func(data);
    }
Utilizing All Cores
Since fuzzing is resource-intensive, it would be ideal to utilize all processor cores that are available in a modern multi-core system. While Honggfuzz is a multi-process and multi-threaded fuzzing engine out of the box, AFL++ needs manual setup to do so. To fuzz in parallel using AFL++, the fuzzing is started with one “master instance” (flagged with-M), and all other instances will be created as “secondary instances” (flagged with -S). The following excerpt is part of a script that can be used to spawn multiple instances of afl-fuzz, each one inside a screen session to be able to log out of the fuzzing host without interrupting the instances:
for i in $(seq -w 1 ${NUM_PROCS}); do
        if < "$i" -eq "1" >; then
            PARAM="-M fuzzer${i}"
        else
            PARAM="-S fuzzer${i}"
        fi

        CMD='afl-fuzz -i ${DIR_IN} -o ${DIR_OUT} ${PARAM} "${BINARY}"'

        echo "<+> starting fuzzing instance ${i} (parameter ${PARAM})..."
        screen -dmS "fuzzer-${i}" ${CMD}
    done
Crash Triage
After running for a while, the fuzzer will ideally have generated a number of inputs (samples) that crashed the target during fuzzing. We now aim to automatically aggregate this set of samples and enrich each sample and the corresponding potential crash with information to drive any further analysis.One of our strategies is to group (cluster) the samples with respect to the behavior of the fuzzing target during execution. Since the resulting clusters then represent different behavior of the fuzzing target, they are easier to triage for (exploitable) bugs. This clustering strategy requires information about the crash and the code path that led to it, which can be collected automatically, using debuggers, for example. Other information that can be automatically collected is whether a crash is deterministically reproducible, and whether the build configuration (affecting, for example, function addresses or variable order) or the runtime environment (e.g., environment variables or network properties) have an impact on whether the target crashes on a particular sample.
Given a sample from the fuzzing run, we can replay that input against the target compiled with different configurations (e.g., both with and without the fuzzer’s instrumentation, with different build-time options, or with and without ASan) and see whether the executions crash. The idea is to have different binaries with different configurations to capture circumstances of a crash with respect to a sample that was generated during a fuzzing run.
For example, if only the instrumented version crashes, then the bug is potentially in the fuzzing-specific code and therefore a false positive. Another example is a sample generated by a fuzzing run on a target with ASan support, where a crash cannot be reproduced with a non-ASan version. In this case, there might be a bug that does not crash the target but could potentially be used to engineer an exploit (e.g., out-of-bound read access to leak sensitive information).
Collecting all of this information will help us better understand why the samples collected by the fuzzer crash the target, under which circumstances, and whether they may have triggered an exploitable bug. Good strategies and tooling are essential to reduce the required amount of manual analysis.
Sample Collection
Since the different fuzzing engines save samples in different ways, another simple but necessary post-processing step to implement is sample collection. AFL++ and Honggfuzz default to storing each sample in its own file and using the filename to save information about the termination signal, the program counter, a stack signature, and the address and disassembled instruction at which the fault occurred.Unfortunately, both fuzzers use a different format out of the box, so the first step in our post-processing pipeline is to collect and move all samples to a shared folder, extract and store information from the filenames, and then rename them to a standard format. Renaming samples to a hash of their contents has worked well for us, because it allows a quick and easy merging of samples from different fuzzing runs.
Information Collection Using GDB
For each sample, we automatically collect information as already indicated. One of the building blocks is an analysis module that usesgdb to collect various information about the crash of a target on a given sample. For the sake of simplicity, we’ll assume that the target expects data either from STDIN or as a command line argument and is unaffected by other vectors that could affect the execution of a binary (e.g., network, environment variables, file system properties). The module invokes gdb as follows:
/usr/bin/gdb -q -nx $binary
The -nx flag is used to avoid loading a gdbinit file, while the -q flag is used to stop gdb printing its version string. After invoking gdb, the following gdb commands are executed automatically:
(gdb) set width unlimited
    (gdb) run {run_payload}
(gdb) backtrace -frame-info short-locationgdb from breaking long lines, e.g., when printing backtraces. The second command executes the fuzzing target, feeding it either the path to the sample or the actual sample content. The third command generates the backtrace. If the execution of the binary finishes without a crash, or times out, the evaluation is stopped and no backtrace is generated.
The backtrace in general is a summary of the program's path to the current point in execution. It consists of stack frames, where each stack frame relates to one nested function call. For example, having a function f() that calls the function g(), and the function g() calls a function h(), and a backtrace is generated inside h(), that backtrace might look as follows:
In summary, by executing the binary once on each sample, gdb will tell us whether the binary crashed at all, and if it did, gdb will yield the signal that terminated the process, as well as a backtrace. The backtrace will provide the names of invoked functions, their addresses, variable states and additional debugging information. The output for an exemplary sample looks as follows:
This information is then parsed, stored in a database and subsequently used to cluster all of the samples in order to reduce the overhead of identifying interesting bugs.
Clustering
After gathering information about all of our samples and adding them to a database, the next step is to try and sort the samples into clusters. Obviously, there are many possible approaches to do that. One method that works very well for us, while being exceedingly simple, is based on hashing the list of addresses of the backtrace. The following source code excerpt shows this approach:def compute_clusterhash(backtrace):
bt_addresses = for frame in backtrace>
return hashlib.md5('.'.join(bt_addresses).encode()).hexdigest()
For each sample, there is an entry in a database that looks as follows:
{
        "sample": "e5f3438438270583ff09cd84790ee46e",
        "crash": true,
        "signal": "SIGSEGV",
        "signal_description": "Segmentation fault",
        "backtrace": <
            {
                "addr": "0x00007ffff7f09592",
                "func": "__memmove_avx_unaligned_erms", <...>
            },
            {
                "addr": "0x00007ffff7fb3524",
                "func": "ReadFromRFBServer", <...>
            },
            {
                "addr": "0x00007ffff7fae7da",
                "func": "HandleTRLE24", <...>
            },
            {
                "addr": "0x00007ffff7f9c9ba",
                "func": "HandleRFBServerMessage", <...>
            },
            {
                "addr": "0x0000555555555762",
                "func": "spin_fuzzing", <...>
            },
            {
                "addr": "0x00005555555558e5",
                "func": "main", <...>
            }
        >
}compute_clusterhash(), as shown below:
>>> compute_clusterhash(example<"backtrace">)
'3c3f5e47c2c59c8ce0272262f87dc7aa'Conclusion
Fuzzing is a well-established technique for discovering new vulnerabilities in software. With this blog, we hope to give you an overview of what is required to successfully fuzz a target, from implementing a harness, to gathering crash information, to using this information for clustering inputs and corresponding crashes for further analysis.Additional Resources
- Learn how CrowdStrike CROWDSTRIKE FALCON® INTELLIGENCE combines automated analysis with human intelligence, enabling security teams, regardless of size or skill, to get ahead of the attacker’s next move.
- CrowdStrike Falcon® Intelligence Premium adds threat intelligence reporting and research from CrowdStrike experts — enabling you to get ahead of nation-state, eCrime and hacktivist attacks.
- CrowdStrike Falcon® Intelligence Elite expands your team with access to an intelligence analyst to help defend against threats targeting your organization.
- Learn how to stop adversaries targeting your industry — schedule a free 1:1 intel briefing with a CrowdStrike threat intelligence expert today.