


![Helping Non-Security Stakeholders Understand ATT&CK in 10 Minutes or Less [VIDEO]](https://assets.crowdstrike.com/is/image/crowdstrikeinc/video-ATTCK2-1?wid=530&hei=349&fmt=png-alpha&qlt=95,0&resMode=sharp2&op_usm=3.0,0.3,2,0)
![Qatar’s Commercial Bank Chooses CrowdStrike Falcon®: A Partnership Based on Trust [VIDEO]](https://assets.crowdstrike.com/is/image/crowdstrikeinc/Edward-Gonam-Qatar-Blog2-1?wid=530&hei=349&fmt=png-alpha&qlt=95,0&resMode=sharp2&op_usm=3.0,0.3,2,0)


?wid=2048&hei=1350&fmt=png-alpha&qlt=95,0&resMode=sharp2&op_usm=3.0,0.3,2,0)


This blog was originally published Aug. 24, 2020 on humio.com. Humio is a CrowdStrike Company.
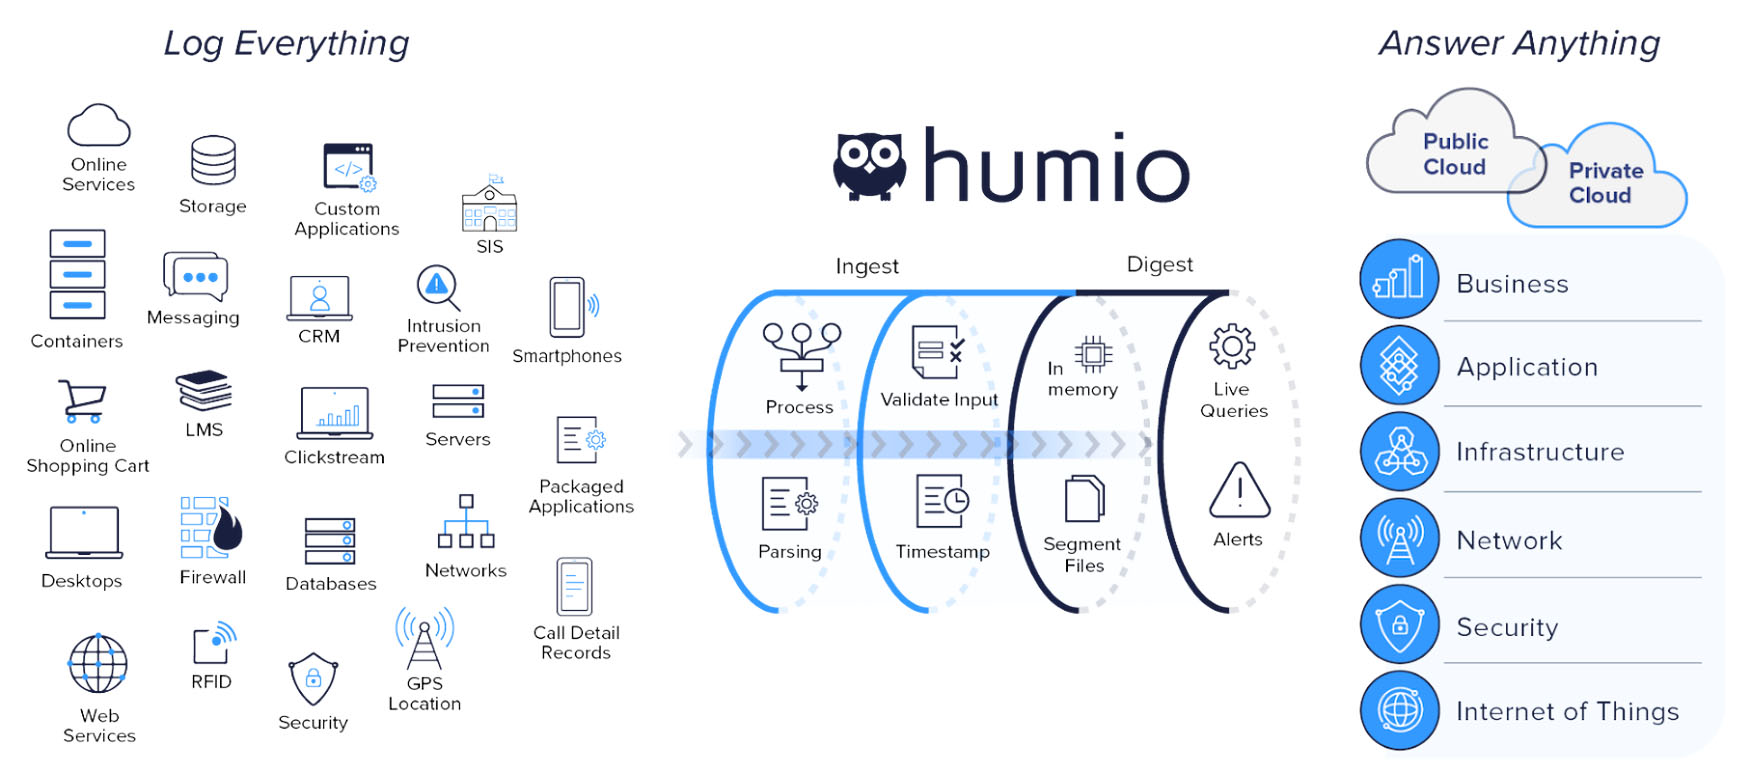
Every organization has a different relationship with their logs. They might be used to monitor operations performance or to enhance the development of applications for employees or customers.Log management
is crucial for security, and can even be used to monitor customer experience with applications or services. Whatever the use case is, there are five main steps to follow in order to extract value from data collected by a centralized log management solution:
- Collect
- Analyze
- Monitor
- Share
- Store
1. Collect
The act of collecting logs can be quite straightforward or complex depending on the tools. Collection typically involves a log shipper and some kind of normalization or parsing. Log shippers take the logs from the device or service that created them and send them into the log management platform. Because most log data is unstructured, it cannot be easily searched in its original format. Parsing gives the data structure, so it is much easier to search. The collection process may also involve data normalization, indexing, compression, and curation. Data normalization is a means of formatting data to make it easier to parse. Indexing is the process of breaking blocks of log data up into segments and then organizing it in a map in order to search it later. Compressing logs helps reduce hardware storage demands and can speed up searching during the analyze phase. Curation is the process of selecting which logs to include in the collection process. Traditional log management tools often require the curation of logs in order to reduce demands on storage and ingestion, whereas modern log management tools are designed to remove this step by efficiently handlingunlimited ingest. It’s important to not just collect logs, but to centralize them in one platform so you are able to search across all the data, enhance the data by connecting it with information to make it more useful, and create visualizations based on your data as a whole. Aggregate all logs and other event data into one place to get
observability
– a complete view of your system.
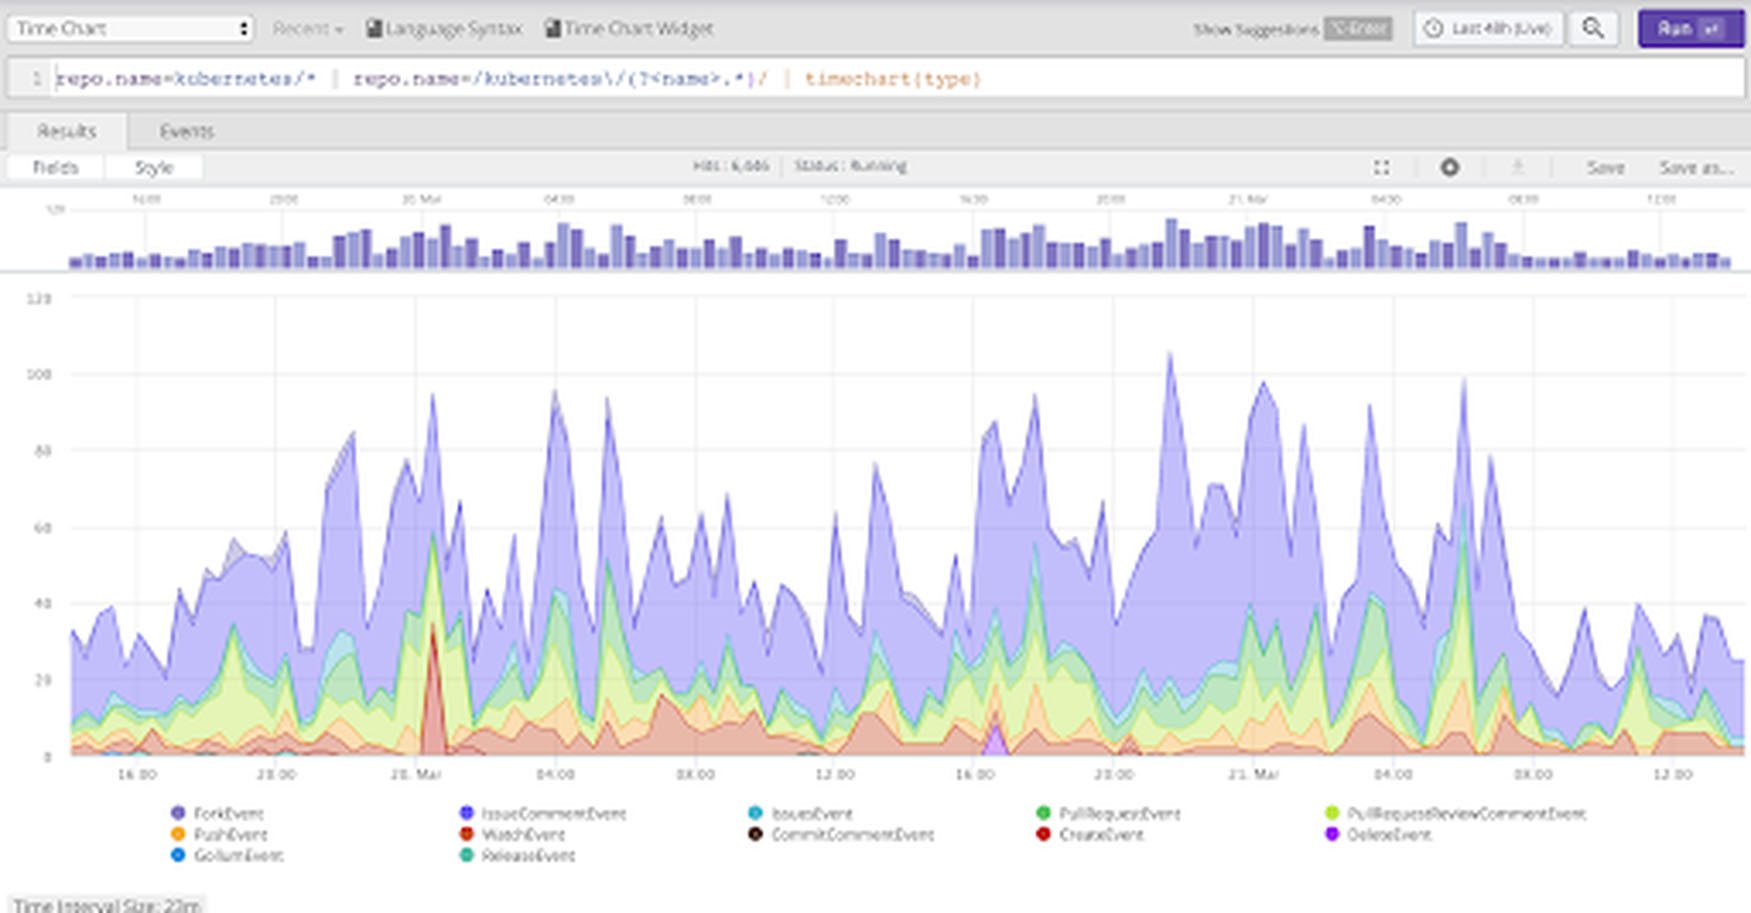
2. Analyze
After collection, logs are analyzed to identify performance issues, application errors, security threats, and business information. A typical use case involves users getting an alert and then going into their tool and actively searching for related logs to determine the root causes of the event that triggered the alert. In addition to this reactive use case, users can also proactively search through all data as a whole, combining various searches filtering relevant data based on time, format, IP addresses, fields, and just about any regular expression (regex) text, and enhanced by correlating it with other data or usingjoins
to combine data from other repositories. In security use cases, the act of threat hunting — exploring new ways to detect security breaches — is common as well. It starts with conceptualizing how your system might be infiltrated by threats looking to damage the system or exfiltrate information. Then hunters look for data clues that correspond with possible forms of attack. For an idea of which tactics and techniques attackers may use, check out the
MITRE ATT&CK Matrix for Enterprise.
3. Monitor
Monitoring means looking for errors and intrusions in real time. Logs are a rich source of data. Nearly all pieces of software and infrastructure generate logs, so they are a powerful means of seeing everything that is going on in the system at the time of an incident, and finding the root cause. Monitoring can be accomplished by looking at dashboards that are reporting errors, displaying traffic patterns, and identifying possible intrusion artifacts in real time. It can also be accomplished by setting up alerts that notify analysts to specific events. Alerts can be configured to be sent through a variety of notifiers including Email, Slack, or customizable tools like PagerDuty. It is possible to add automation to the monitoring process by customizing alerts to fit the functions on the system, or import rules that may call your attention to common instructions or security threats. Automation tasks can be triggered by alerts , which can be configured to take actions such as setting up a firewall to protect against an attack or expanding resources on a cloud server to accommodate growing traffic.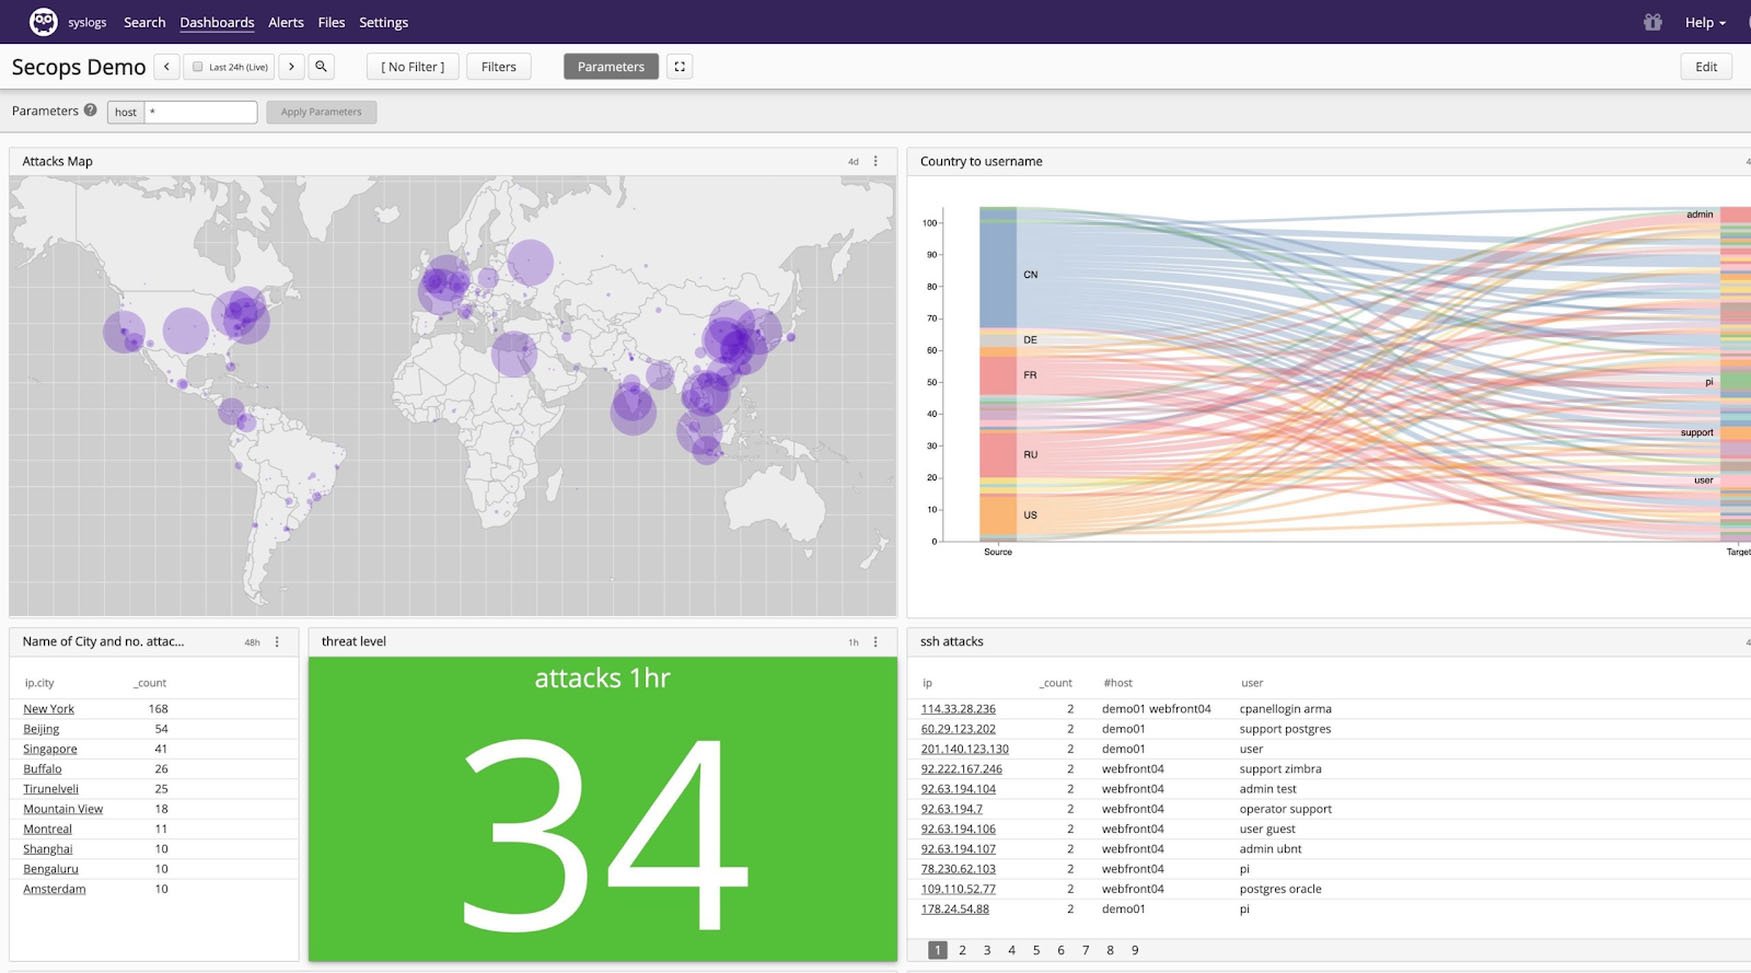
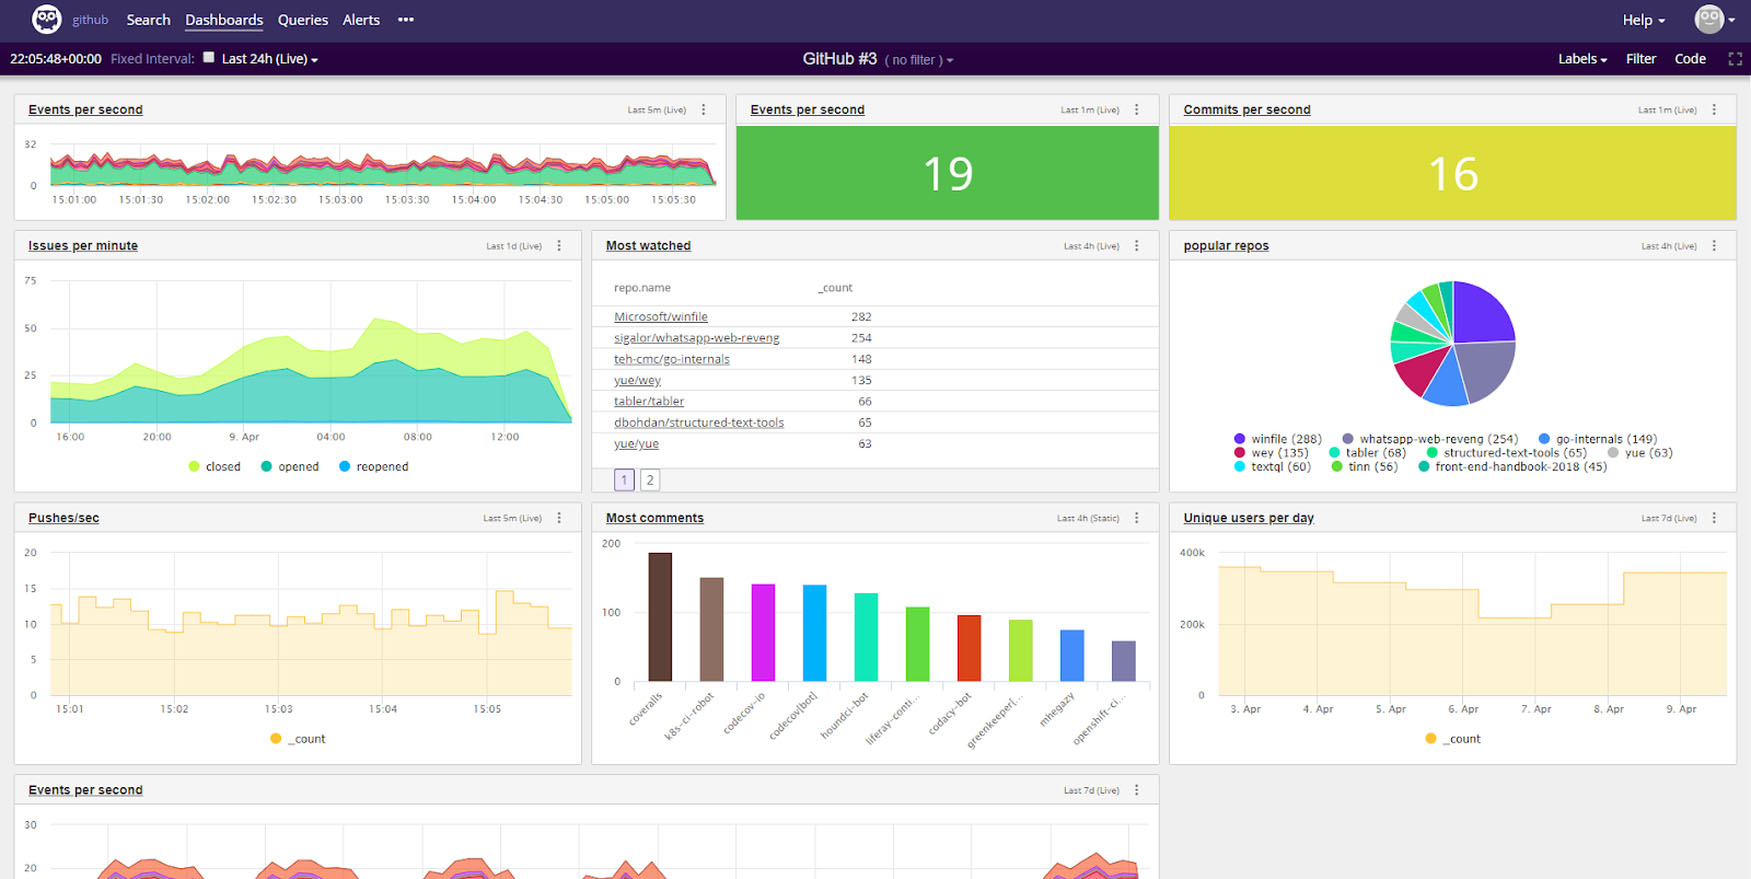
4. Share
The same live dashboards that are used for monitoring purposes can be shared throughout an organization. Live data can create an impact in a wide variety of departments including sales, support, security, operations, development, and more. Support teams can see what a user may be experiencing based on their logs. Sales can see potential customer behavior. Operations can see system performance. Developers can see application bugs. Shared data can take the form of systemwide performance data in dashboards, or as detailed root-cause data available through searching logs. Dashboards provide an easy-to-read resource that provides value at a glance without the need for additional information, but there are also instances where users can interact with the data on adeeper level
by filtering or searching further. Some log management tools allow users to share the results of a security investigation via log reports which summarize search and analysis and provide an easy-to-read resource for a non-technical audience to review or discuss.
5. Store
The final step is to store the log data so it can be retrieved and searched later. This can be done as two separate processes, where data is separated into retained data that can be searched, and stored data that is archived but only available if it is reindexed. This is sometimes called cold storage. Modern systems can store data using cloud bucket storage, which can be significantly less expensive. Some systems can use bucket storage for all data, where anything that is stored can be searched as retained data, essentially providing affordable unlimited retention. Modern systems like Humio compress log data by 10-20x or more, which is a significant factor in reducing log management storage requirements. Log management tools that don’t add bulky indexes further reduce the hardware required for storage. Log management users often decide to save on storage costs by limiting the time they keep logs available, and choose to delete them after a short amount of time. Many use cases have regulatory compliance requirements that dictate the length of storage and may vary based on region. Choosing the appropriate storage length is vital. If you delete something you need later, there’s no going back. The best log management systems allow for unlimited logging and longer retention with affordable options for storage.Choosing a log management tool
Even when considering log management at its most basic collection of steps, it becomes apparent there are many features to consider when choosing a tool. To determine which one is right for you, we recommend exploring how it performs at each step of the process.- Collect
- Is the tool flexible enough to collect all sources you need? Is it fast enough at collecting your volumes of data to give you real-time search results? - Analyze
- How quickly and easily can you find answers to your questions? - Monitor
- Does your solution provide an actionable real-time view of your system? - Share
- Does the solution make data accessible across your organization? - Store - Does the tool have a good compression rate that will reduce hardware storage costs?
Get Started with Humio
Humio is a purpose-built self-hosted or SaaS log management platform that uses modern architecture to optimize for streaming data at an enterprise scale. It provides blazing fast search, and efficiently uses compute and storage resources to provide the lowest TCO. Get started looking at a log management tool that answers the needs for cost and performance by signing up for a freelive demo of Humio with one of our engineers.
