In previous sections of this series, we discussed the architecture and mechanisms in Apache Kafka for handling logs in a distributed framework. This included some commands to manipulate simple and compacted logs using the console APIs.
As your number of logs increases, you may encounter issues such as data accessibility and disk congestion. In addition, mitigation requires different compaction methods that include retention policies and Kafka log compaction techniques. These techniques enable cost-effective log storing, but tracing the events source of a complex system in numerous logs can be tedious. For this, Kafka offers various metrics to integrate into your monitoring system, helping you to save time and effort while maintaining a healthy cluster.
In this section, we’ll dive deeper into these metrics, including integration for monitoring Kafka clusters, investigating performance logs, and the benefits of monitoring a Kafka cluster.
Learn More
Explore the complete Kafka Logging Guide series:
- Part 1: The Basics
- Part 2: Advanced Concepts
- Part 3: Managing Performance Logs
- Part 4: Securing Kafka Logs
Metrics to monitor Kafka
When working with large applications comprising numerous components (such as microservices, databases, messaging queues, and load balancers), clear visibility over your entire infrastructure is crucial. Without proper monitoring, you may suddenly encounter complications. If your Kafka cluster fails to host records or there is connection instability between producer and consumer with brokers, then you need the visibility to fix these issues quickly.
Fortunately, Kafka provides many metrics integrations according to your business needs. These metrics identify and resolve bottlenecks quickly and easily.
Types of Kafka metrics
The Kafka system comprises three main components: brokers, producers, and consumers. Each of these components maintains its own set of metrics, providing in-depth information about the current and previous state.
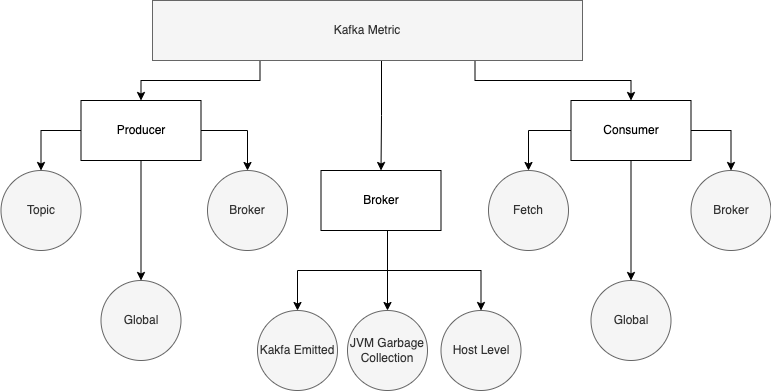
Producer metrics
Producers are responsible for generating messages that are sent to consumers via brokers. Therefore, producers must be closely monitored to avoid data lag and slow performance.
Producer metrics contain three categories:
- Topic-level metrics focus on statistics regarding record generation, such as the total number of succeeded or failed records in a topic.
- Broker-level metrics emphasize the relation between a broker and a producer, such as the average number of requests sent and received by the producer.
- Global metrics cover all aspects of producers, such as request latency rates and response rates.
Available producer metrics include:
- compression-rate: the average compression rate of batches for a single topic obtained from the ratio of compressed batch size to uncompressed size.
- compression-rate-avg: the average compression rate of batches for all topics sent to the broker.
- response-rate: the average rate of response received from the broker.
- request-rate: the average rate of request sent to the broker.
- io-wait-ratio: the average time spent waiting to send the data to the broker.
Consumer metrics
Consumers are responsible for consuming messages from the broker, and they should be monitored to support a stable and healthy cluster. Consumer metrics contain three categories:
- Fetch-level metrics focus on record-consumption statistics, such as the total number of records received, and the average number of messages fetched.
- Broker-level metrics maintain a healthy connection between a broker and a consumer, such as the average number of requests sent and received by the consumer.
- Global metrics cover all aspects of consumers, such as request latency rates and response rates.
Available consumer metrics include:
- records-consumed-rate: the average compression rate of batches for a single topic, obtained from the ratio of compressed batch size to uncompressed size.
- heartbeat-rate: the average count of heartbeats per second sent to the broker. A heartbeat is a network message sent from a consumer to a Kafka server to validate its connectivity.
- response-rate: the average rate of responses received from the broker.
- request-rate: the average rate of requests sent to the broker.
- io-wait-ratio: the average amount of time spent waiting to receive the data from the broker.
Broker metrics
Brokers are the backbone of every Kafka cluster, responsible for storing and maintaining logs and for sustaining the connection between the producers and consumers. Apache Kafka offers many metrics to monitor the cluster’s servers that help to anticipate when to scale and what course of action to take to avoid a noticeable bottleneck.
Broker metrics can be further divided into the following categories.
Kafka-emitted metrics
Apache Kafka provides Kafka-emitted metrics to cover the entirety of brokers inside the cluster. Kafka-emitted metrics include the following categories:
- Under Replicated Partition: Highlights the unavailability of one or more brokers for all topics. This ensures that the value of the metric (shown below) must at all times be equal to zero. A non-zero value indicates that one or more replicas are down, and immediate actions should be taken for their availability.
kafka.server: type=ReplicaManager,name=UnderReplicatedPartitions
- Active Controller Count: The controller keeps track of partition leaders and coordinates in electing new partition leaders. The active controller value must always be equal to one, and immediate action should be taken should the value equal anything but one.
kafka.server: type=KafkaController,name=ActiveControllerCount
- Offline Partitions Count: Each partition has an active leader to which the data is written. This metric outputs a number that represents the availability of the broker. A non-zero value indicates that the broker is unavailable, and all subscriptions are blocked until the leader becomes available.
kafka.server: type=KafkaController,name=OfflinePartitionsCount
- Unclean Leader Elections: When a partition leader goes down, an election occurs among the in-synced replicas, and a new leader is elected. If no leader is available, the partition is taken offline unless an unclean election is enabled explicitly using the metric below.
kafka.server: type=ControllerStats,name=UncleanLeaderElectionsPerSec
Host-level metrics
Host-level metrics govern the host’s current state and must be closely monitored to ensure the server is operational and equipped with enough resources.
- CPU utilization must be below a well-defined threshold—ideally below 60%—to ensure all processes are operational.
- Disk utilization monitoring in Kafka is critical, so the servers have enough space to capture the data. Ideally, at least 40% of a disk should be available at all times.
- Page-to-cache read ratio should be kept at a minimum when possible.
JVM garbage collection metrics
Kafka relies heavily on the Java garbage collection utility to free up memory, resulting in the frequent execution of garbage collectors. This leads to performance issues, as the application execution is halted while the garbage collector cleans up the heap.
JVM statistics show the current state of the Java runtime processes. Therefore, it is crucial to keep an eye on the following JVM statistics when monitoring performance:
- CollectionCount: The total number of garbage collection processes executed.
- CollectionTime: The total time the collection processes consumed in milliseconds.
Investigating performance logs
Applying the metrics detailed above allows for the investigation of performance logs. To investigate Kafka logs, it is necessary to enable verbose logging for the brokers. Verbose logs are detailed logs that help debug issues the cluster encounters, such as a log burst.
How to enable verbose logging
The following steps enable verbose logging at the broker level:
- Log into the broker and navigate to the Kafka home directory.
- Edit the log4j.properties file inside the config folder.
- Modify the logger value and set it to DEBUG, as below:
log4j.logger.kafka=DEBUG
Set the logging path
The following steps configure the log path to store log files inside the broker:
- Inside the broker, navigate to the config folder of Kafka.
- Edit the server.properties and set the value of log.dirs as shown in the code block below.
- Restart the broker server.
log.dirs=/var/logs/testing-kafka
How to investigate a log burst
When complex data is continuously generated, the probability of a log burst increases. Configure your cluster with monitoring metrics and logging using the above instructions. Next, follow these steps to debug abnormalities like a log burst.
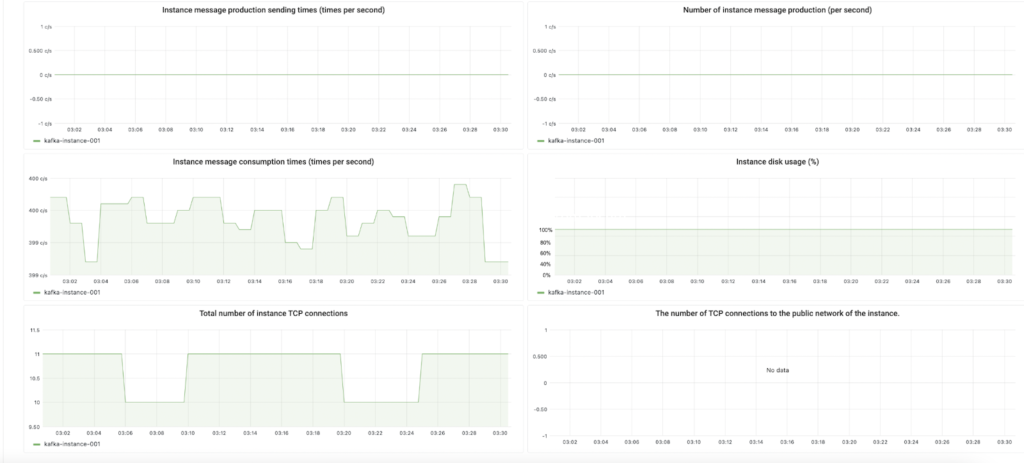
Investigate current statistics
Inspect current statistics using an enabled dashboard to help you determine troubling elements. For example, in the snippet below, the disk is fully utilized, and high traffic causes log bursts.
Investigate the log file
Navigate to the log directory and open the controller log file to see the last message being logged.
root@broker:/var/logs/testing-kafka# cat controller.log2023-01-24 00:21:47.873999054 topic crowdstrike received 0x7f4efdd459d0ejdjejejr from producer-001112xw21
2023-01-24 00:21:48.873999054 topic crowdstrike 0x7f4efdd459d0ejdjejejr written to disk
2023-01-24 00:21:48.973999054 topic crowdstrike confirmation sent to producer-001112xw21
2023-01-24 00:21:47.873999054 topic falcon received 0x899f4efdd459d0ejdjejejr from producer-11342xw21
Fix the disk congestion issue
In order to fix this issue, back up and remove log files that are no longer required. You can also increase the disk volume to accommodate the incoming large batches of records. Restart the broker server, and monitor the system resources to verify the correctness of the cluster.
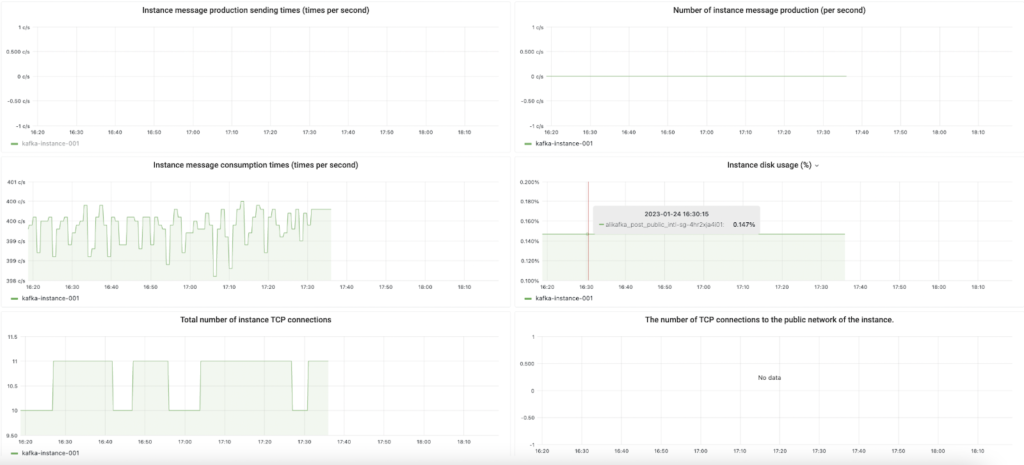
Monitor the cluster
Soon, you’ll see that disk utilization is below the threshold, and the brokers are able to write and send data without any issues.
Debugging the cluster is one of the many benefits of Kafka metrics. Let’s consider other benefits of monitoring Kafka metrics and logs.
Additional benefits of monitoring your Kafka cluster
Monitoring in Kafka enables robust control and visibility over your entire application’s ecosystem, providing you with the following:
- Real-time tracking of resource utilization. Use each component’s CPU and memory usage to predict when and what resources will need to scale.
- Preempting resource exhaustion issues, such as the disk congestion problem.
- Insights on the JVM heap state which help you detect and remedy memory leakage and potential thread deadlocks.
- Controller and replication monitoring, to prevent log burst and data loss.
Kafka’s architecture contains different performance monitoring metrics that can be integrated into clusters. These metrics help overcome common issues in clusters with troubleshooting codes, as demonstrated in our log burst scenario above.
Looking ahead to security
The next section of this series will cover the basics of securing Kafka brokers and topics, including how to apply encryption at both the server and record levels using various approaches. Access control lists will demonstrate how to manage Kafka logs securely with the Authorizer Plugin.
Log your data with CrowdStrike Falcon Next-Gen SIEM
Elevate your cybersecurity with the CrowdStrike Falcon® platform, the premier AI-native platform for SIEM and log management. Experience security logging at a petabyte scale, choosing between cloud-native or self-hosted deployment options. Log your data with a powerful, index-free architecture, without bottlenecks, allowing threat hunting with over 1 PB of data ingestion per day. Ensure real-time search capabilities to outpace adversaries, achieving sub-second latency for complex queries. Benefit from 360-degree visibility, consolidating data to break down silos and enabling security, IT, and DevOps teams to hunt threats, monitor performance, and ensure compliance seamlessly across 3 billion events in less than 1 second.
Arfan Sharif is a product marketing lead for the Observability portfolio at CrowdStrike. He has over 15 years experience driving Log Management, ITOps, Observability, Security and CX solutions for companies such as Splunk, Genesys and Quest Software. Arfan graduated in Computer Science at Bucks and Chilterns University and has a career spanning across Product Marketing and Sales Engineering.