IT system logs are essential in helping engineers to perform the following tasks::
- Troubleshooting application performance bottlenecks
- Determining the root cause of availability issues
- Debugging software code
- Investigating security breaches
- Planning infrastructure capacity
- Maintaining audit compliance requirements
- … and more.
Modern cloud-based, distributed applications depend heavily on container technology. These applications often rely on Kubernetes for container orchestration that yields seamless scaling and robust fault tolerance. With this shift in deployment infrastructure from bare metal to containers, logging and monitoring techniques have changed.
Storing logs in containers or virtual machines isn’t practical because both are ephemeral. Therefore, a different approach is necessary to capture logs from Kubernetes-hosted applications.
This article is part one of a guide that covers Kubernetes Logging fundamentals. We will introduce the Kubernetes logging architectures and explain the node-level logging patterns in detail.
Learn More
Explore the complete Kubernetes Logging Guide series:
- Part 1: The Basics
- Part 2: Advanced Concepts
- Part 3: Centralizing Kubernetes Logs
- Part 4: Centralized Logging in a Kubernetes Cluster
Kubernetes Logging Basics
In a production Kubernetes environment, hundreds or even thousands of containers can exist in different states—running,, stopping, restarting, or terminating—at any given moment.
Logging drivers
Kubernetes doesn’t provide a native solution for storing logs. However, it ships with some logging drivers to facilitate storing and aggregating logs. By default, Kubernetes uses the json-file driver, which formats all log entries to JSON and internally caches them. The syslog and journald logging drivers help writing to Linux log systems. Other logging drivers like FluentD, AWS CloudWatch, and GCP Logs facilitate writing logs to external log aggregator services.
Logs from Kubernetes system components
Kubernetes logs can come from the container orchestration system and from containerized applications.
Kubernetes system components include the Kubernetes Scheduler, kube-proxy, kubelet, and the container runtime. The Kubernetes scheduler and kube-proxy run inside a container and always write logs to the local /var/log directory irrespective of the driver used. The kubelet and the container runtime write logs to the systemd journal if it’s present or to the /var/log directory if it’s not.
Node-level logging
In a Kubernetes environment, the node or the cluster manages the application logs. In node-level logging, the Pod writes application logs to the node where it’s running. The container engine redirects any application log message to the stdout or stderr streams. The node’s logging driver picks up the messages and writes them to the appropriate log file. If there’s no driver configured, logging defaults to json-file.
You can use the following command to check which logs use the default driver.
kubectl logs <pod_name>
Node-level logging, however, has a significant shortcoming: A Pod’s logs are lost if the node goes down or Kubernetes evicts that Pod.
Cluster-level logging
Cluster-level logging involves a centralized logging service aggregating logs from all the nodes. This solves the problem of losing node-level logs by pushing all the node-level logs to a backend service. There are two ways to achieve cluster-level logging.
The first method uses a node-level agent configured as a DaemonSet. A DaemonSet is a Kubernetes feature where every node (or some of them) runs a copy of the Pod. In a later section of this guide, we will show how to use this approach for effective logging.
The second method uses a sidecar pattern, where every Pod contains a sidecar container that captures logs and sends those logs to an external service.
Capturing Logs Using a Node-level Logging Agent
A node-level logging agent is an always-on service that runs in a container in a separate Pod.
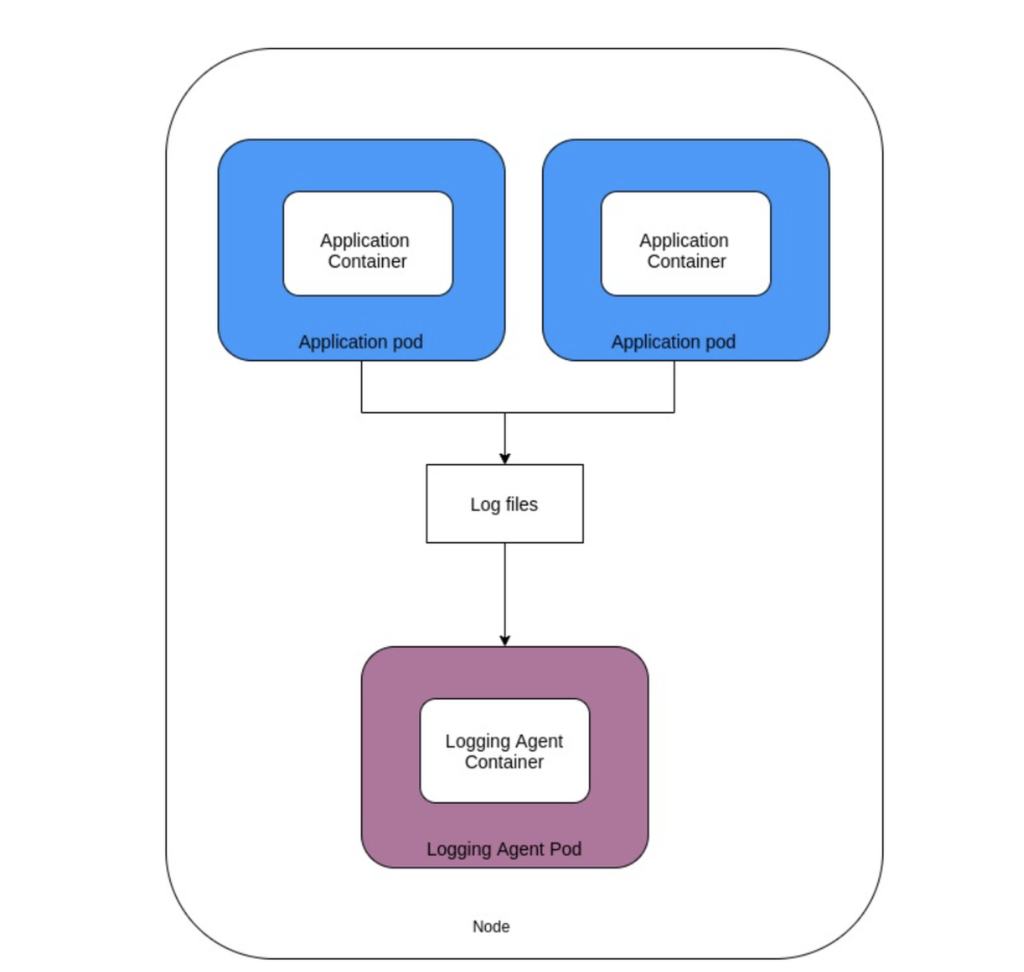
A node-level logging agent is useful when your environment matches the following conditions:
- There is a resource constraint in the nodes. A single node-level agent can capture logs from all the application Pods in that node, ensuring the resource consumption remains low.
- There is common log storage for all the Pods.
- There is a need for basic multi-tenant isolation without complex requirements. A separate resource allocation isn’t possible here since one logging agent caters to all application Pods.
Using a node-level logging agent has several advantages:
- It is easy to set up.
- Resource usage is low.
- Since the agent uses the same mechanism as the default logging configuration, the logs are available through the
kubectlcommand. - There’s no need to change anything in the application Pods.
Configuring the node-level logging agent in Kubernetes
The Kubernetes node-level agent uses the DaemonSet pattern. A DaemonSet runs a copy of a specific Pod in every cluster node (or some of its nodes). Every time you add a new node to the cluster, that Pod gets added to the new node as well. When you remove a node (or the cluster scales down), Kubernetes automatically garbage-collects that Pod. The DaemonSet feature allows you to run a Pod to collect logs from all the Pods in a node and send those to a log management service.
To capture logs from a specific directory, developers can use an open-source log collection agent like Fluentd. Fluentd has a GitHub repository that contains sample configurations for different logging backends.
Let’s assume that we want to send the DaemonSet Pod’s logs collected by Fluentd to an Elasticsearch backend. We would use this sample configuration from the GitHub repo.
The first step in deploying this configuration is to create a service account for the Fluentd logging agent. The code snippet below shows how to do this.
apiVersion: v1kind: ServiceAccount
metadata:
name: fluentd-logger-daemonset
namespace: logging
labels:
app: fluentd-logger-daemonset
Save the file as fluentd_service_account.yaml, and run the command below to create the service account.
kubectl apply -f fluentd_service_account.yaml
Next, create the configuration for the DaemonSet. You can use the following configuration file to do this.
apiVersion: extensions/v1beta1kind: DaemonSet
metadata:
name: fluentd
namespace: kube-system
labels:
k8s-app: fluentd-elasticsearch-daemonset
spec:
template:
metadata:
labels:
k8s-app: fluentd-elasticsearch-daemonset
spec:
containers:
- name: fluentd
image: fluent/fluentd-kubernetes-daemonset:elasticsearch
env:
- name:  FLUENT_ELASTICSEARCH_HOST
value: "<elasticsearch-host-url>"
- name:  FLUENT_ELASTICSEARCH_PORT
value: "<elasticsearch-host-port>"
volumeMounts:
- name: logdir
mountPath: /var/log
volumes:
- name: logdir
hostPath:
path: /var/log
The important part of this specification is the kind attribute that specifies the Pod will run as a DaemonSet. The spec template field is mandatory and defines the base image for creating the DaemonSet. This configuration uses the default fluentd image as the base image. Like all Kubernetes configuration files, it’s necessary to specify the apiVersion and the metadata keys. The application container logs are mounted to the /var/log directory.
You can save this configuration as fluentd_daemonset_account.yaml and run the command below to create the Pod in all the cluster nodes.
kubectl apply -f fluentd-daemonset.yaml
This will initiate a node-level logging agent Pod in all your cluster nodes. It’s possible to run the Pod only on specific nodes by using the nodeSelector parameter (under spec.template.spec). Without this parameter, Kubernetes creates the Pod in every node.
Conclusion
Troubleshooting containerized microservices can be tricky. Gone are the days when an engineer could log into each physical server and tail logs from the command shell. Compared to logs from other clustered applications, Kubernetes logs—both from the orchestrator and the application—are challenging to manage because Pods are ephemeral. That’s why you must collect logs from every node and send those to a central location outside the cluster for persistence and later analysis.
As we covered in this guide, a DaemonSet pattern allows quick and easy implementation of node-level logging agents in Kubernetes. You don’t have to make any changes to the application, and its resource usage is low. However, this solution doesn’t offer separate log storage or comprehensive multi-tenant isolation features for each application. For those functionalities, you would need to use a sidecar-based approach.
In Part Two of our guide, we will discuss the sidecar implementation, specifically its pros and cons, and common use cases.
Log your data with CrowdStrike Falcon Next-Gen SIEM
Elevate your cybersecurity with the CrowdStrike Falcon® platform, the premier AI-native platform for SIEM and log management. Experience security logging at a petabyte scale, choosing between cloud-native or self-hosted deployment options. Log your data with a powerful, index-free architecture, without bottlenecks, allowing threat hunting with over 1 PB of data ingestion per day. Ensure real-time search capabilities to outpace adversaries, achieving sub-second latency for complex queries. Benefit from 360-degree visibility, consolidating data to break down silos and enabling security, IT, and DevOps teams to hunt threats, monitor performance, and ensure compliance seamlessly across 3 billion events in less than 1 second.
Arfan Sharif is a product marketing lead for the Observability portfolio at CrowdStrike. He has over 15 years experience driving Log Management, ITOps, Observability, Security and CX solutions for companies such as Splunk, Genesys and Quest Software. Arfan graduated in Computer Science at Bucks and Chilterns University and has a career spanning across Product Marketing and Sales Engineering.