In this section of our Python logging guide, we’ll take what we’ve learned in previous sections and apply it to a popular Python-based web framework: Django. Specifically, we’ll cover:
- Django logging basics
- Creating a basic Django app
- Default Django logging behavior
- Modifying the output of Django logs
- Customizing a Django log configuration
Learn More
- Part 1: The Basics
- Part 2: Advanced Concepts
- Part 3: Centralized Python Logs
- Part 4: Logging with Django
Introduction to Django logging
Django uses Python’s logging module by default. Familiar Python logging concepts like loggers, log levels, handlers, filters, and formatters apply to Django. Django’s default logging configuration gives developers a head start, and can be customized to meet application-specific requirements. The built-in Django loggers are:
django: The root logger in thedjangologging hierarchy, under which all of the following loggers are found.django.request: The logger for HTTP error messages. Server error messages (5XX HTTP codes) have ERROR-level severity. Client error messages (4XX HTTP codes) have WARNING-level severity.django.server: The logger for Django’s development web server, which is started with therunservercommand but should NOT be used in production.django.template: The logger for Django template rendering.django.db.backends: The logger for database interactions.django.security.*: The logger that tracks Django security errors like those related toSuspiciousOperation.
The default behavior of the django.server is to emit logs of INFO severity and higher to the console, while the other loggers propagate logs up to the django root logger. How those logs are emitted depends on the DEBUG setting in your Django settings.py file:
- If
DEBUG = TRUEthen messages of INFO or higher are emitted to the console. - If
DEBUG = FALSEthen messages of ERROR or higher are emitted to the console.
Working with logging in a Django app
Now that you know the basics of Django logging, let’s walk through a practical example of how to use it. For our example, we’ll use Windows 11, Python 3.10.10, and Django 4.1.7, but you can follow along on most modern Django development environments.
Warning: Our basic app is not intended for production use.
Create a basic Django app
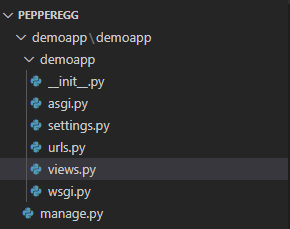
For our basic app, we’ll make a few tweaks from the skeleton web app you get after you run django-admin startproject <project_name>. We’ll use the name demoapp for our project.
Create your views.py file
To begin, we’ll create a views.py file in our demoapp directory.
We add the following Python code to views.py file. This code is a slightly extended version of Django’s simple view example. The inline comments explain what each line does.
# Import Django's HttpResponse classfrom django.http import HttpResponse
# Import Python's datetime module
import datetime
# Create a function
def egg(request):
# Get the day of the week, format it as a human-readable word
day = datetime.date.today().strftime('%A')
# Create a basic HTML page with a title, H1 header,
# and message that includes the day of the week
html = "<head><title>Pepper and egg is still great</title></head>
<body>
<h1> Breaking breakfast news! </h1>
Today is %a. <br>
<b> Latest news: Pepper and egg is great </b>
</body></html>" % day
# Return the HTML content
return HttpResponse(html)
Update the settings.py file
Next, we’ll make some changes to our settings.py file.
- Set
DEBUG = Falseto turn off debug mode.
- Add
localhosttoALLOWED_HOSTSso we can access our server atlocalhost:8000with debug mode turned off.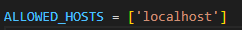
- Append
demoappto theINSTALLED_APPSsection so Django recognizes it.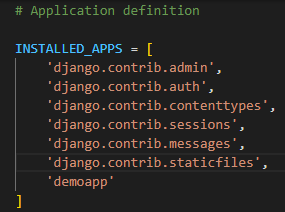
Configure urls.py
The urls.py file routes URLs to Django “views.” In our case, we’ll keep the default admin page and add a URL path pointing to the egg function in our views.py file.
from django.contrib import adminfrom django.urls import path
from .views import egg
urlpatterns = [
# point /admin to the default admin page
path('admin/', admin.site.urls),
# make our egg function in views.py the home page
path('', egg, name='home')
]
Launch the Django app
Next, we run python3 manage.py migrate to apply the default migrations. If we were to run the app as is, without migration, Django would throw errors.
Then, we run the app with this command:
python3 manage.py runserver
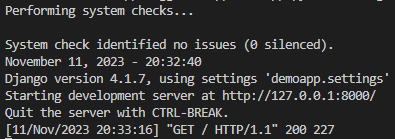
You should see output similar to the following:
Performing system checks...System check identified no issues (0 silenced).
November 11, 2023 - 11:11:11
Django version 4.1.7, using settings 'demoapp.settings'
Starting development server at http://127.0.0.1:8000/
Quit the server with CTRL-BREAK.
On your development machine, use a web browser to access http://localhost:8000 and you should see a page similar to this:
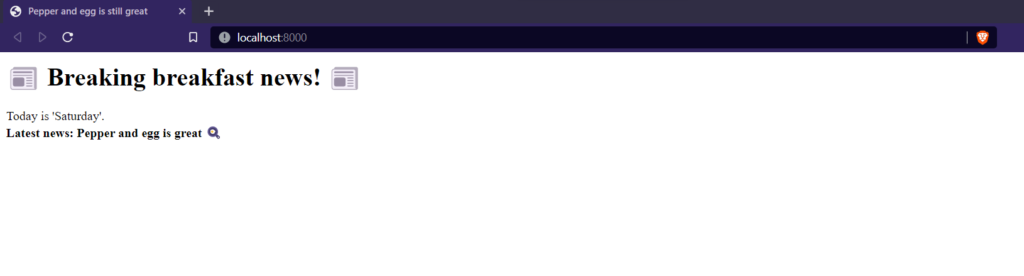
You’ll notice that the console where you launched the app includes log messages for each HTTP request. That’s the default django.server logger in action.
Update console logging
Now that we have a working app with basic console logging, let’s tweak the logging functionality.
First, we can update the severity of messages that print to the terminal. By default, the django logger will display messages of ERROR level or higher if debug mode is off. We’ll make our modifications by adding a LOGGING dictionary to our settings.py file. We’ll use a slightly modified version (different log level plus clarifying comments) of the example from Django’s official docs.
- Add
import osto the top of thesettings.pyfile in thedemoappproject.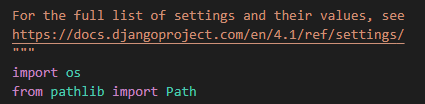
- Append the following code to the end of the
settings.pyfile.
# Create a LOGGING dictionaryLOGGING = {
# Use v1 of the logging config schema
'version': 1,
# Continue to use existing loggers
'disable_existing_loggers': False,
# Create a log handler that prints logs to the terminal
'handlers': {
'console': {
'class': 'logging.StreamHandler',
},
},
# Define the root logger's settings
'root': {
'handlers': ['console'],
'level': 'DEBUG',
},
# Define the django log module's settings
'loggers': {
'django': {
'handlers': ['console'],
'level': os.getenv('DJANGO_LOG_LEVEL', 'DEBUG'),
'propagate': False,
},
},
}
Once you save the changes, you should see DEBUG-level messages print to the terminal.
Next, we’ll update the formatting of the log messages. To do this, we need to add a formatter to our logging dictionary and then add that formatter to our handler. Again, using an example from the Django docs, our formatter will use this format:
{levelname} {asctime} {module} {process:d} {thread:d} {message}{levelname}is the message's log level (WARNING, INFO, DEBUG, etc.).{asctime}is a date and time stamp in aYYYY-MM-DD HH:MM:SS,MSformat (e.g.,2023-11-11 11:11:11,123).{module}is the module that emitted the log record.{process:d}is the process ID associated with the log record.{thread:d}is the thread ID associated with the log record.{message}is the log message.
To implement these changes, follow these steps:
- Add a
formatterwith this content after thedisable_existing_loggerssection of the LOGGING dictionary insettings.py:'formatters': {'verbose': {
'format': '{levelname} {asctime} {module} {process:d} {thread:d} {message}',
'style': '{',
},
},
- Add the new
verboseformatter to the existingconsolehandler.'handlers': {'console': {
'class': 'logging.StreamHandler',
# Below is the line we've added
'formatter': 'verbose',
},
},
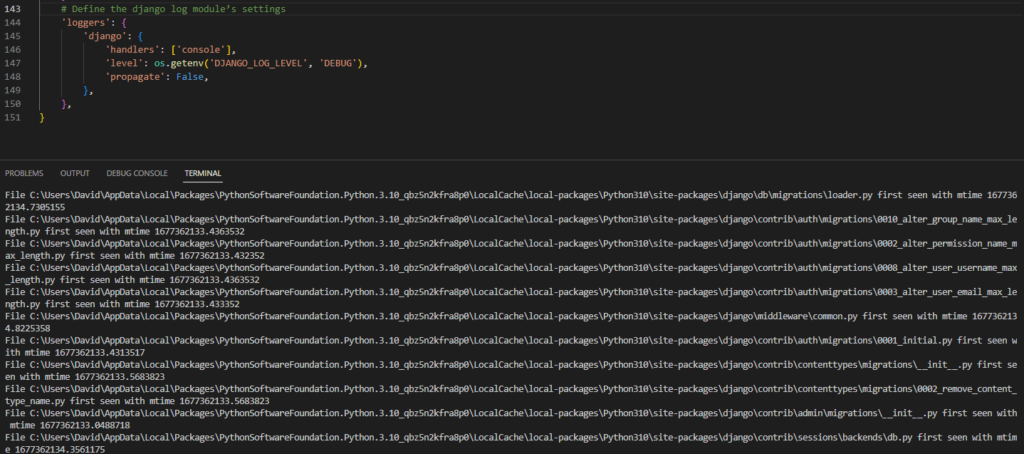
You should see messages similar to this print in your terminal:
DEBUG 2023-11-11 11:11:11,111 autoreload 22512 31700 File C:UsersPepperAndEggAppDataLocalPackagesPythonSoftwareFoundation.Python.3.10_qbz5n2kfra8p0LocalCachelocal-packagesPython310site-packagesdjangocontribcontenttypesmigrations002_remove_content_type_name.py first seen with mtime 1611111111.5683823
Add logging to a file
Now that we know how to tweak Django logging settings, let’s modify where we send our logs. Output to the terminal can be useful, but it isn’t always the ideal location. For our example, printing only to the terminal means we aren’t persisting our logs if we need to review them in the future. Let’s update our Django logs to print to a file.
To send our logs to a file, we’ll need to first create the new handler in our settings.py LOGGING dictionary. First, we’ll append the following code to the handlers section of the LOGGING dictionary:
# Add a handler to write logs to a file'file': {
# Use the FileHandler class
'class': 'logging.FileHandler',
# Specify a local log file as a raw string. Use your app's directory.
'filename': r'C:PepperAndEggdemoappdemoappdjango.log',
},
Note: update filename path to match your environment.
Next, we’ll add that handler to our root logger and the django logger:
# Define the root logger's settings'root': {
# Use the console and file logger
'handlers': ['console', 'file'],
'level': 'DEBUG',
},
# Define the django log module's settings
'loggers': {
'django': {
# Use the console and file logger
'handlers': ['console', 'file'],
'level': os.getenv('DJANGO_LOG_LEVEL', 'DEBUG'),
'propagate': False,
},
When you’re done, the LOGGING dictionary in settings.py should look similar to this:
# Create a LOGGING dictionaryLOGGING = {
# Use v1 of the logging config schema
'version': 1,
# Continue to use existing loggers
'disable_existing_loggers': False,
# Add a verbose formatter
'formatters': {
'verbose': {
'format': '{levelname} {asctime} {module} {process:d} {thread:d} {message}',
'style': '{',
},
},
# Create a log handler that prints logs to the terminal
'handlers': {
'console': {
'class': 'logging.StreamHandler',
# Add the verbose formatter
'formatter': 'verbose',
},
# Add a handler to write logs to a file
'file': {
# Use the FileHandler class
'class': 'logging.FileHandler',
# Specify a local log file as a raw string. Use your app's directory.
'filename': r'C:PepperAndEggdemoappdemoappdjango.log',
},
},
# Define the root logger's settings
'root': {
# Use the console and file logger
'handlers': ['console', 'file'],
'level': 'DEBUG',
},
# Define the django log module's settings
'loggers': {
'django': {
# Use the console and file logger
'handlers': ['console', 'file'],
'level': os.getenv('DJANGO_LOG_LEVEL', 'DEBUG'),
'propagate': False,
},
},
}
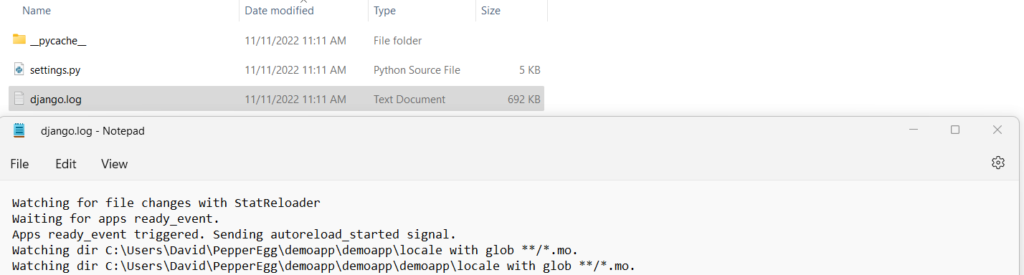
Once we save the changes, we’ll see logs print to a local django.log file.
Next steps with Django logging
Now that you know the basics of Django logging, you can move on to applying them to real-world projects. Django logging gets even more powerful when combined with some of the other concepts we’ve discussed in this series. For example, you can centralize your Django logs and emit them to a platform like CrowdStrike Falcon® LogScale.
Log your data with CrowdStrike Falcon Next-Gen SIEM
Elevate your cybersecurity with the CrowdStrike Falcon® platform, the premier AI-native platform for SIEM and log management. Experience security logging at a petabyte scale, choosing between cloud-native or self-hosted deployment options. Log your data with a powerful, index-free architecture, without bottlenecks, allowing threat hunting with over 1 PB of data ingestion per day. Ensure real-time search capabilities to outpace adversaries, achieving sub-second latency for complex queries. Benefit from 360-degree visibility, consolidating data to break down silos and enabling security, IT, and DevOps teams to hunt threats, monitor performance, and ensure compliance seamlessly across 3 billion events in less than 1 second.
Arfan Sharif is a product marketing lead for the Observability portfolio at CrowdStrike. He has over 15 years experience driving Log Management, ITOps, Observability, Security and CX solutions for companies such as Splunk, Genesys and Quest Software. Arfan graduated in Computer Science at Bucks and Chilterns University and has a career spanning across Product Marketing and Sales Engineering.