In part two of this series, we’ll dive deeper into Azure Monitor Logs and see its tools and services. We will then create a logs analytics workspace to store logs, run Kusto Query Language (KQL) queries, and look at how we can create alerts and Azure Monitor dashboards with query results.
Learn More
- Part 1: The Basics
- Part 2: Advanced Concepts
- Part 3: Security Concepts and Best Practices
- Part 4: Log Ingestion
Azure Monitor Logs
Azure Monitor Logs is one half of the Azure Monitor Platform. You can use Azure Monitor Logs to ingest and analyze logs from several resources and applications. Azure Monitor Logs include several tools.
Log Analytics Workspace
The Log Analytics Workspace (LAW) is a critical component for data aggregation. A LAW stores all logs in the Azure monitor logs platform, and you must create at least one LAW to use Azure Monitor Logs.
Once you create a LAW, you must configure log sources to send logs to the new workspace. There are no charges associated with creating a new workspace. However, the data is ingested as Analytics Logs, and you are charged for ingestion into the workspace. The pay-as-you-go pricing plan is the default option.
If you plan on ingesting over 100GB of data per day, then commitment-tier pricing might help to reduce costs. Organizations or users that ingest over 500GB of data daily into Azure Monitor Logs can use dedicated clusters to save even more on data ingestion costs.
Log Analytics Tool
The Azure log analytics tool allows users to write, edit, and run KQL queries on data stored in Log Analytics Workspaces. You can use the log analytics tool to write all kinds of KQL queries for data analytics. It also offers hundreds of pre-made queries for common use cases.
Log Analytics Agent
The Log Analytics Agent is software you install on an Azure virtual machine (VM) to integrate application logs with Azure Monitor Logs. When you deploy an application to Azure, you will likely deploy it to an Azure VM. It is possible to write application code that writes log files locally on an Azure VM. However, it is crucial to export logs from the VMs to use analytics and prevent accidental deletions. This is where the Log Analytics Agent comes into play.
You can use the Log Analytics Agent to send any logs generated by your application to a LAW. Keep in mind that the Log Analytics Agent cannot send metrics to Azure monitor metrics. The Log Analytics Agent is quite challenging to implement at scale as it requires a unique configuration for each VM.
Important Logs to Check
When using Azure, you should keep track of the following Platform Logs:
- Activity Logs: These are the most important types of logs in Azure. Monitoring these logs can help you analyze what or who made changes to your Azure services.
- Resource Logs: These logs can help you determine the health and availability of Azure Resources.
- Azure AD Logs: Monitoring these logs can help you analyze all changes in Azure Active Directory.
Operations in Azure Monitor Logs
In this section, we’ll provide a step-by-step guide to performing key operations in Azure Monitor Logs.
Data Aggregation and Storage
To store logs in Azure Monitor, first create a LAW. Navigate to the workspace. You’ll find the Log Analytics Workspaces option under Services. Alternatively, you can use the Azure portal search and type “log analytics workspace”.
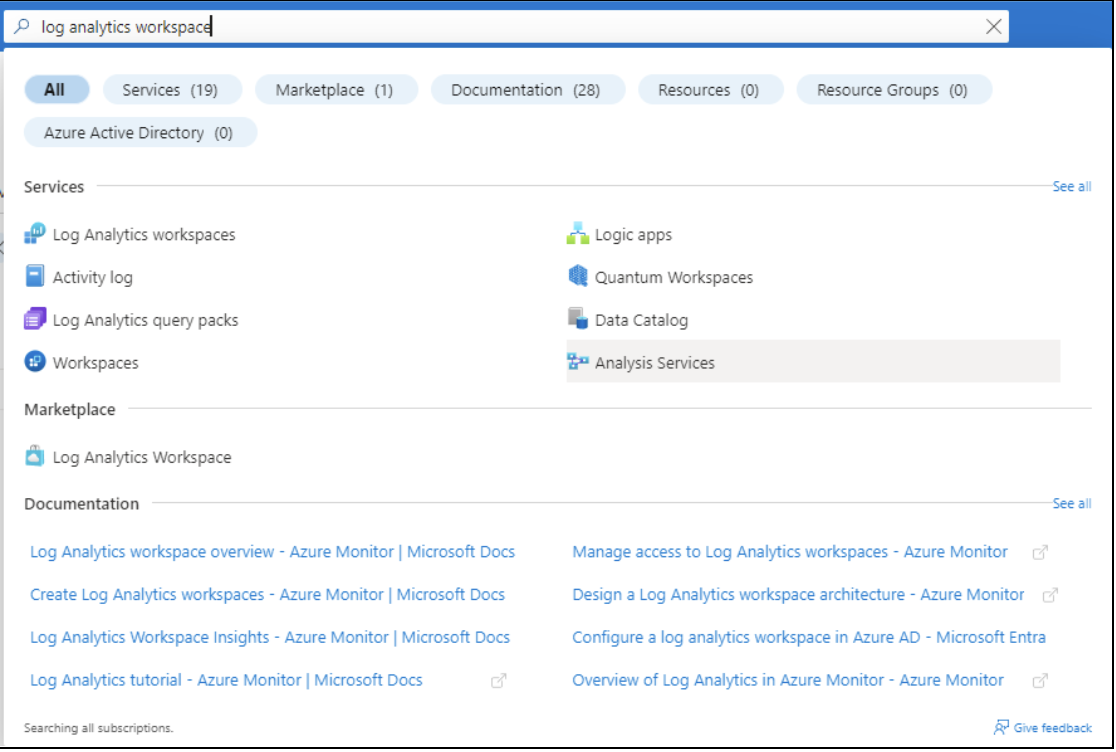
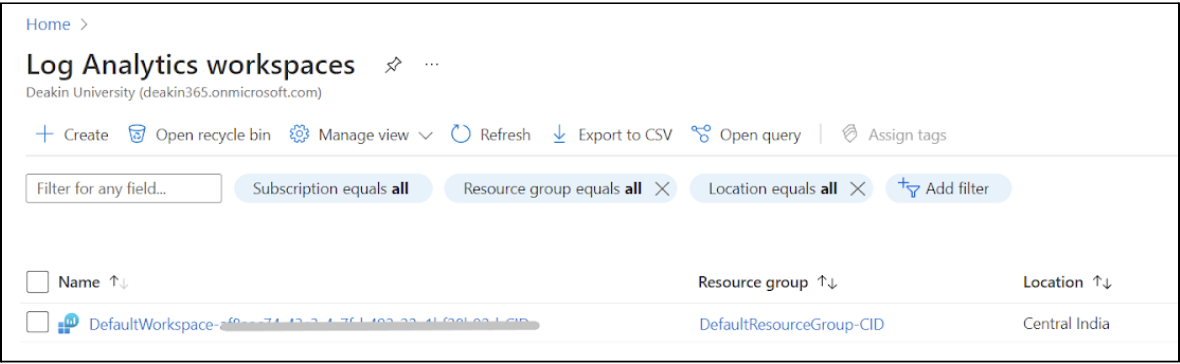
In the screenshot below, you can see the default analytics workspace for this account. To create a new workspace for the demo, click on the + Create button.
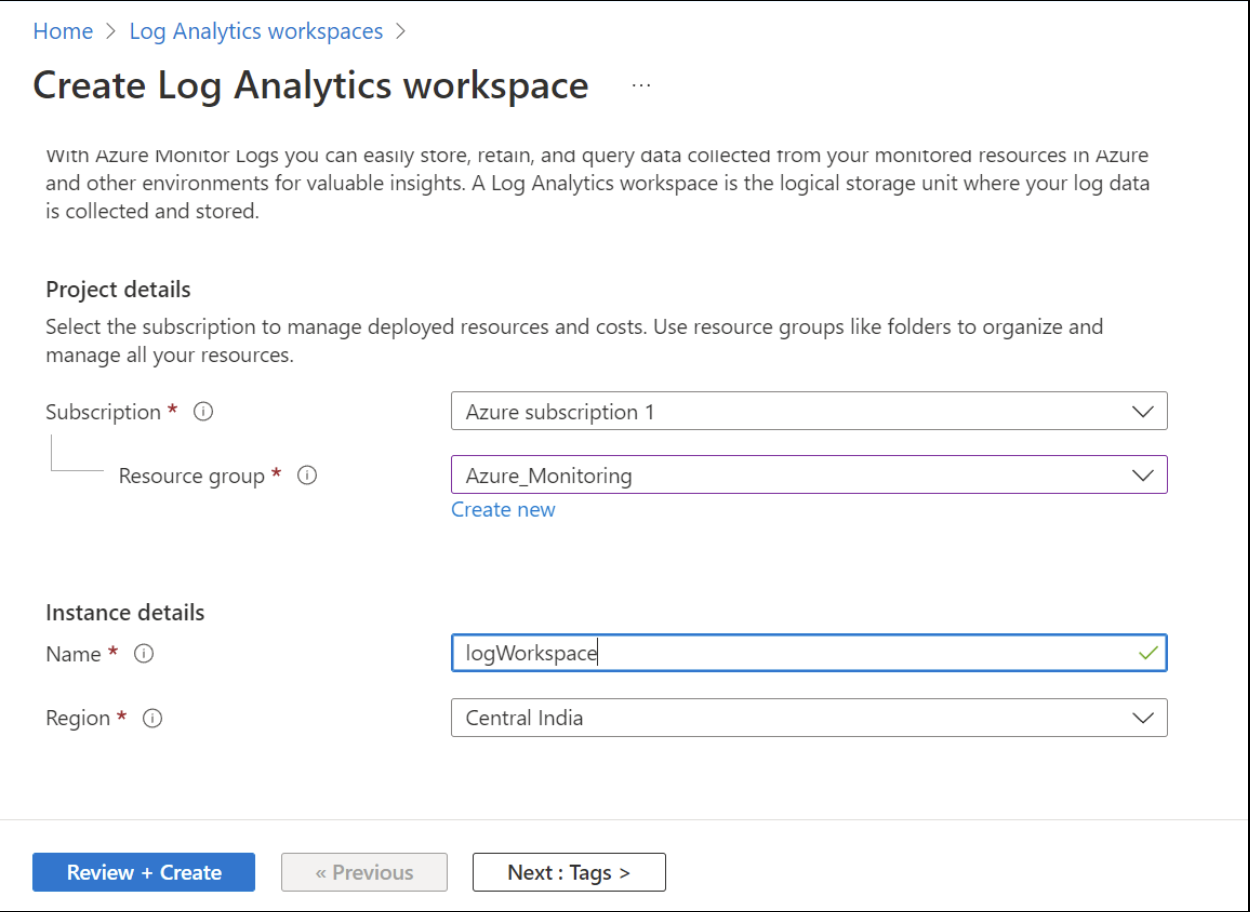
Choose a subscription and resource group for this workspace and enter a workspace name. Click on the Review and + Create buttons to create the workspace.
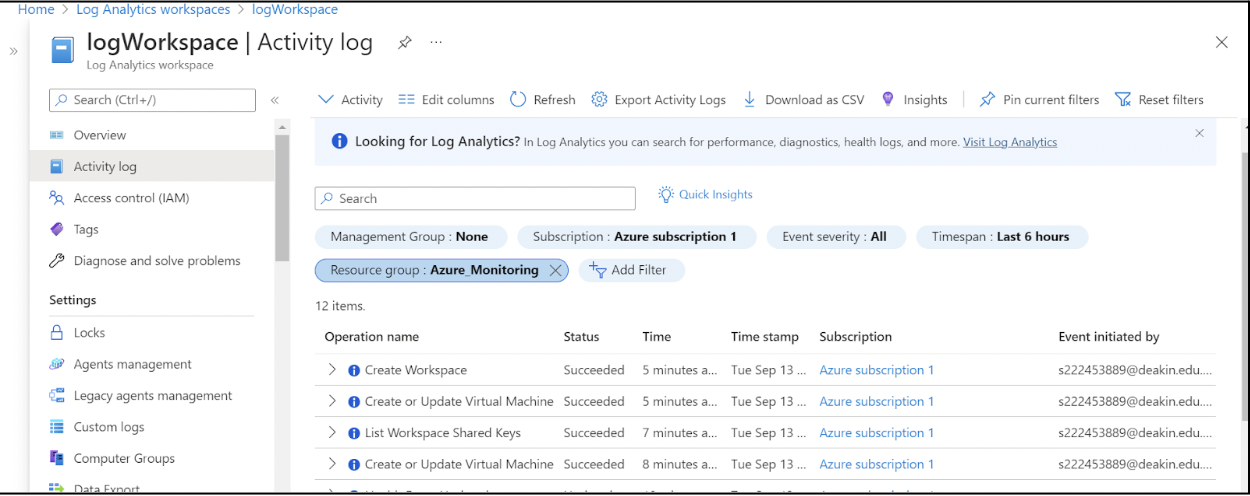
Once you’ve created and deployed the workspace, click on the workspace and head to the Activity log page. All activity logs for the resource group Azure_Monitoring are collected in this workspace. You can see the event type, name, and user who initiated this event. This information is essential to keep track of all user activity in the Azure portal.
You need to configure this workspace to connect to VMs in this resource group. Scroll down to find the Virtual machines page and click on the VM in the list to connect the VM to this workspace.
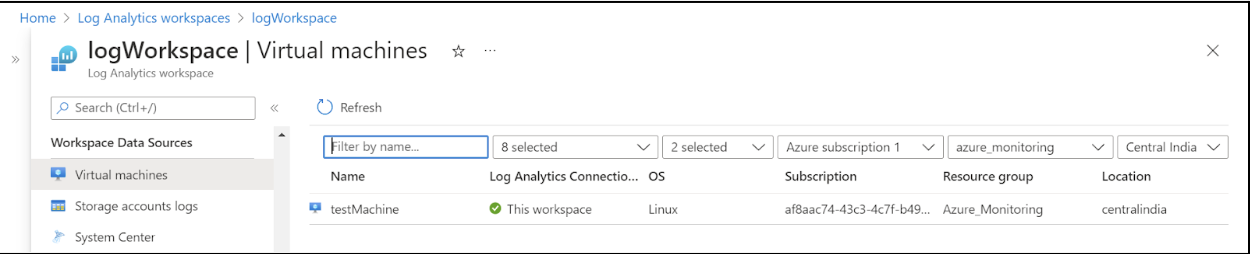
You have now successfully created a new Log Analytics Workspace and connected a VM to this workspace.
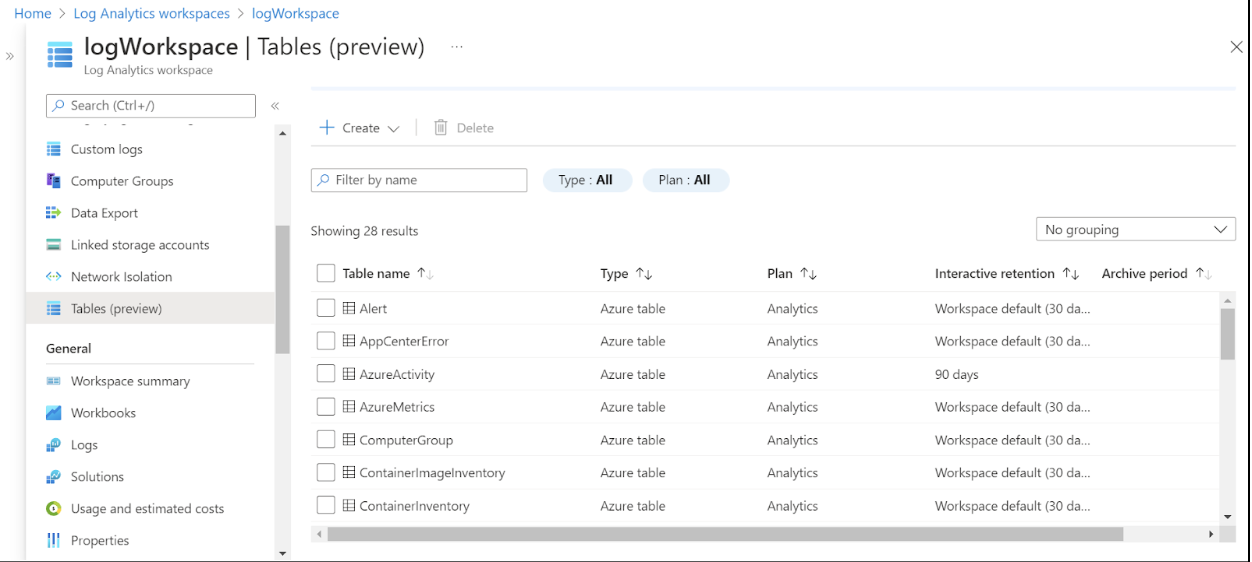
You can also see the Azure Activity logs for all management operations performed in this resource group. Before running any KQL queries on logs, head to the Tables section. This section displays the log tables that Azure has created for the account. You can run queries against these tables and perform complex operations (like JOIN) across tables.
Log Analytics
To access the Log Analytics Tool, navigate to the Logs page in your workspace. Azure has a pre-made glossary of commands and queries that you can use to run common analytics commands.
However, when your default workspace is new and does not have much initial data, it is possible that some queries in this section do not work as expected. For this, we’ll check the availability of a VM using a KQL query.
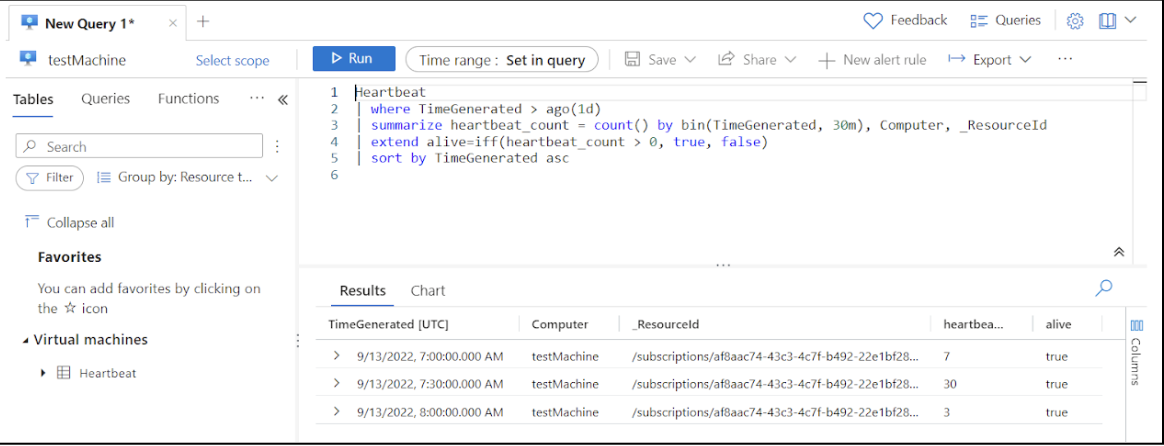
Each VM connected to a workspace sends a metric (called a Heartbeat) once per minute. By using this metric, we can check the VM’s availability over the last day.
Heartbeat| where TimeGenerated > ago(1d)
| summarize heartbeat_count = count() by bin(TimeGenerated, 30m), Computer, _ResourceId
| extend alive=iff(heartbeat_count > 0, true, false)
| sort by TimeGenerated asc // sort the results by time (ascending order)
This query shows the availability of the VM over the past day.
Visualize
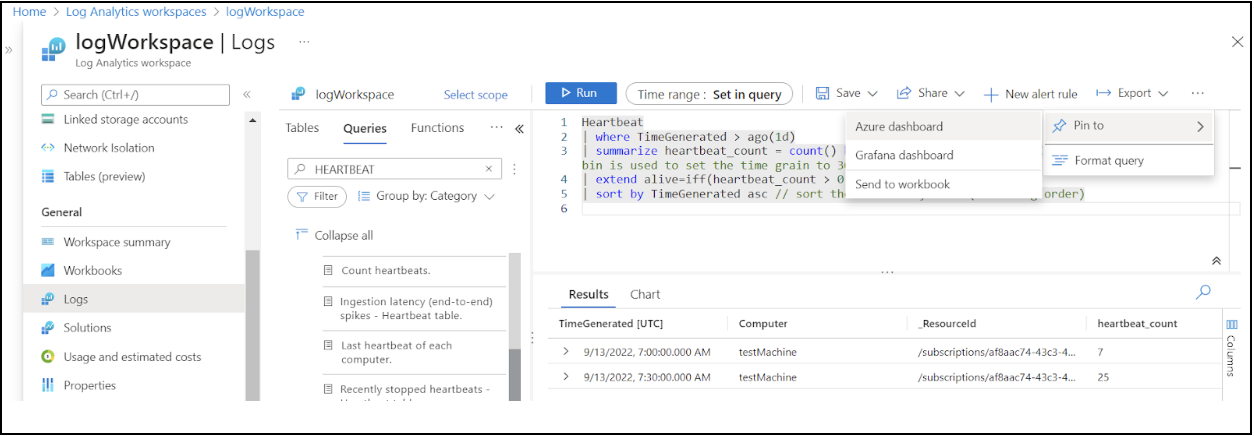
So far, we’ve seen how to analyze logs in Azure Monitor Logs. However, we also need to be able to visualize log analytics and present the analytics results. When running a query, you can choose to “pin” the query results to Azure Monitor, Grafana, or an Azure Workbook.
Alerting
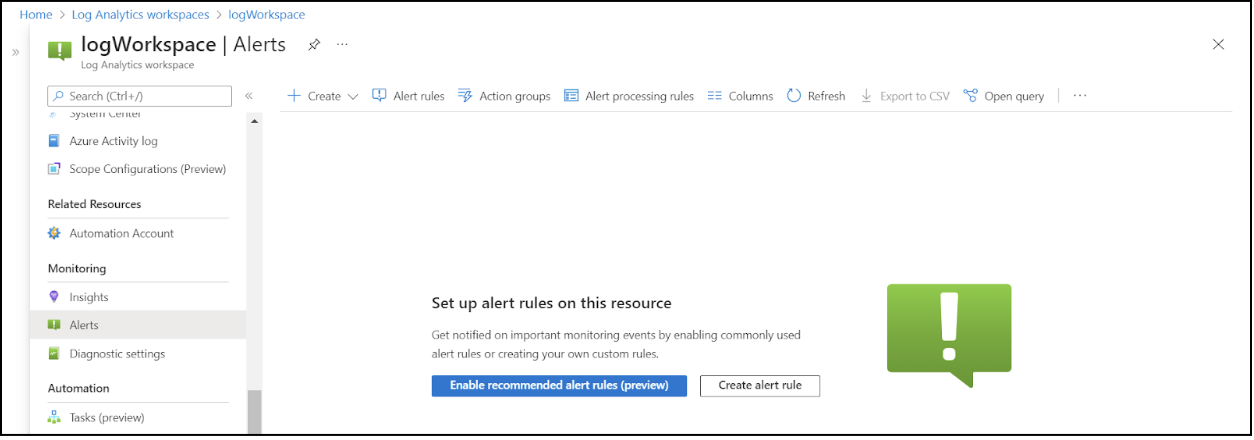
You can create alerts on log query results. In the example below, we’ll see how to create an alert that is triggered when our VM becomes unavailable.
First, navigate to the Alerts page and click the Create alert rule button.
Choose the Custom log search option.
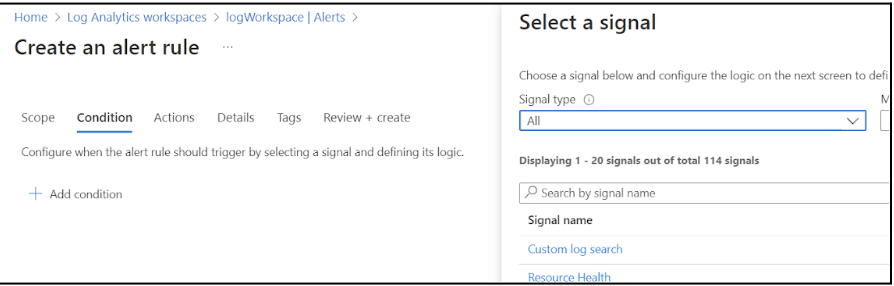
Next, enter the following query:
Perf| where CounterName == "% Processor Time" and ObjectName == "Processor" and InstanceName == "_Total"
| summarize AggregatedValue = avg(CounterValue) by bin(TimeGenerated, 1hr), Computer
| render timechart
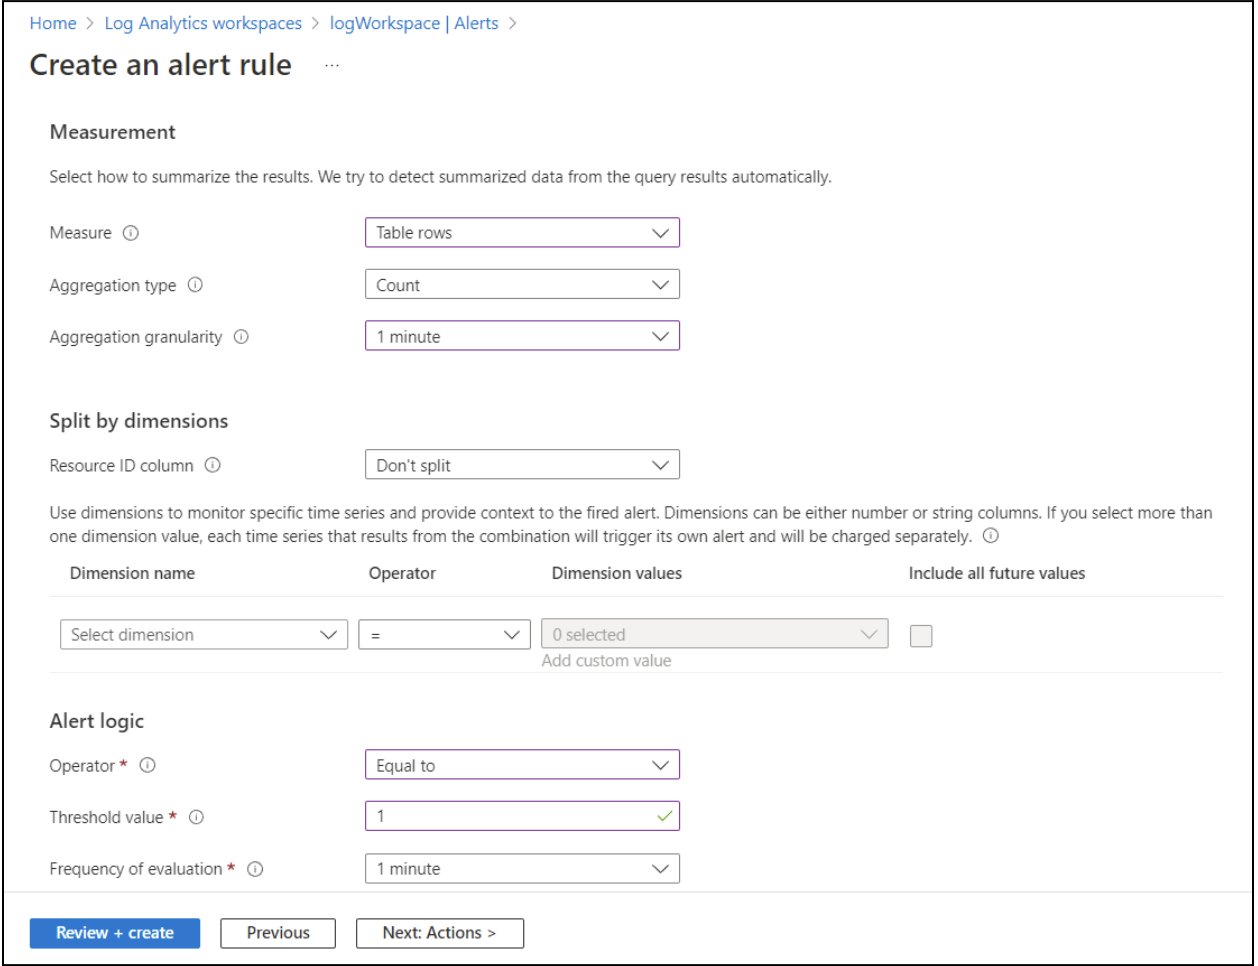
To configure the measurement and alerting logic, set the Measure field to Table rows. In the drop-down menu for the Aggregation type, select Count. Set the alert logic Operator to Equal to and the Threshold value to 1. These settings allow this event to fire whenever the heartbeat command results in an output of 1.
You can set any granularity and evaluation frequency depending on your specific needs and requirements.
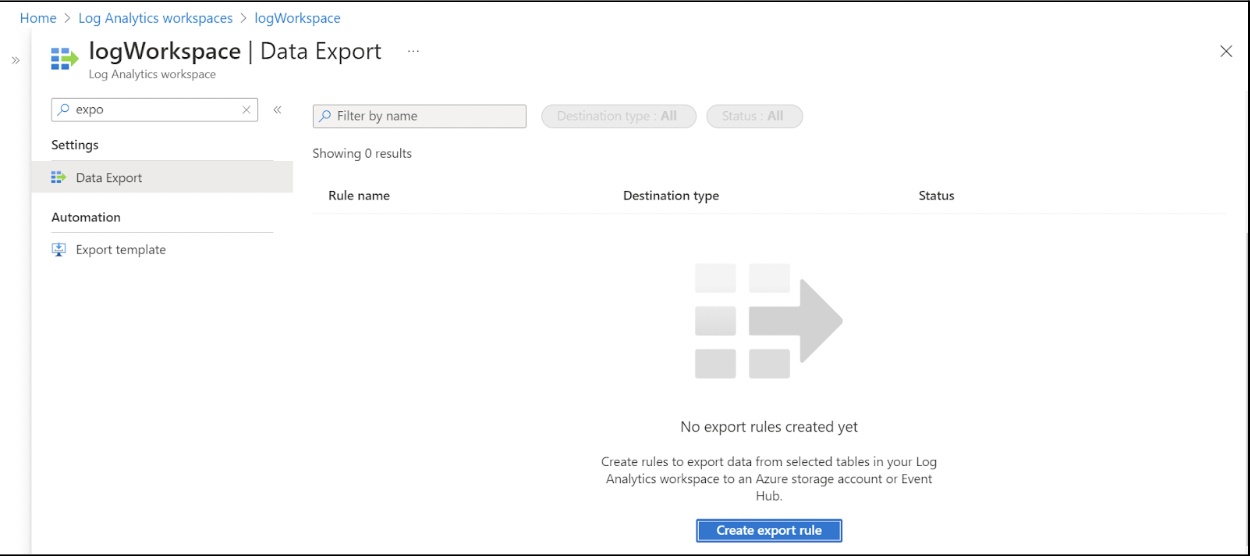
Export
You can use the Data Export feature to configure data rules in the log analytics workspaces for exporting log tables to a storage account or event hubs.
Log your data with CrowdStrike Falcon Next-Gen SIEM
Elevate your cybersecurity with the CrowdStrike Falcon® platform, the premier AI-native platform for SIEM and log management. Experience security logging at a petabyte scale, choosing between cloud-native or self-hosted deployment options. Log your data with a powerful, index-free architecture, without bottlenecks, allowing threat hunting with over 1 PB of data ingestion per day. Ensure real-time search capabilities to outpace adversaries, achieving sub-second latency for complex queries. Benefit from 360-degree visibility, consolidating data to break down silos and enabling security, IT, and DevOps teams to hunt threats, monitor performance, and ensure compliance seamlessly across 3 billion events in less than 1 second.
Arfan Sharif is a product marketing lead for the Observability portfolio at CrowdStrike. He has over 15 years experience driving Log Management, ITOps, Observability, Security and CX solutions for companies such as Splunk, Genesys and Quest Software. Arfan graduated in Computer Science at Bucks and Chilterns University and has a career spanning across Product Marketing and Sales Engineering.