We can optimize the use of our logs by following best practices and collecting data from different application components. With Azure Monitor log ingestion, users can collect log data from multiple sources, including services such as Azure Virtual Machines, Azure Storage and Azure SQL Database. Azure Monitor can ingest this data for analysis and insight into the performance and availability of applications.
In this article, we discuss log ingestion and how to do this with the Azure Monitor. We also cover log ingestion solutions, including the Log Ingestion API and HTTP Data Collector API.
Learn More
- Part 1: The Basics
- Part 2: Advanced Concepts
- Part 3: Security Concepts and Best Practices
- Part 4: Log Ingestion
Log Ingestion
Software development teams use log ingestion to import logs into a central store after gathering them from multiple sources. By monitoring and analyzing their application logs efficiently, they can spot potential issues and make informed decisions about their software infrastructure.
The method of collecting, processing and storing log data from various sources usually requires the use of specialized API solutions. With these solutions, teams can automate log ingestion, thereby simplifying access to — and analysis of — massive amounts of log data.
Log ingestion solutions in Azure Monitor help you send data to a Log Analytics workspace from multiple sources.
Logs Ingestion API
By using the Logs Ingestion API, teams can send data from various sources to the allowed built-in tables or custom tables in the Logs Analytics workspace. Expanding the schemas and adding new columns to the built-in tables is also possible.
How the Logs Ingestion API works
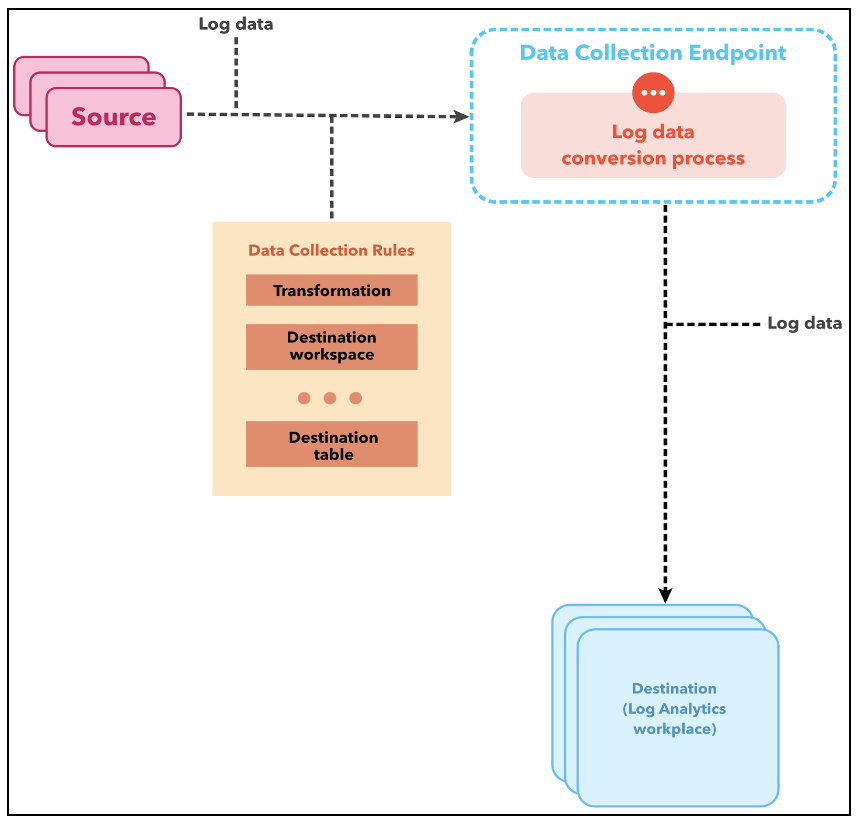
Data collection endpoints (DCEs) are specific connection points for your subscription that receive data from your application. The JSON source data exists in your API request payload. The API call performs the following three tasks:
- Defines a data collection rule (DCR) that recognizes the source data structure.
- Refines and converts the source data to a structure valid in the target table.
- Sends the transformed data to the target table in the workspace.
The following diagram shows how log data flows from the source to the Log Analytics workspace through the DCE.
Supported tables for the Logs Ingestion API
The built-in tables in the Log Analytics workspace and any custom tables you create can receive data from the Logs Ingestion API. However, the target table must exist before you send data to it. For custom tables, the _CL suffix must be present. For example, a table for DashboardLogs would have DashboardLogs_CL as its name. The API supports the following built-in tables:
- CommonSecurityLog
- SecurityEvents
- Syslog
- WindowsEvents
Steps for using the Logs Ingestion API
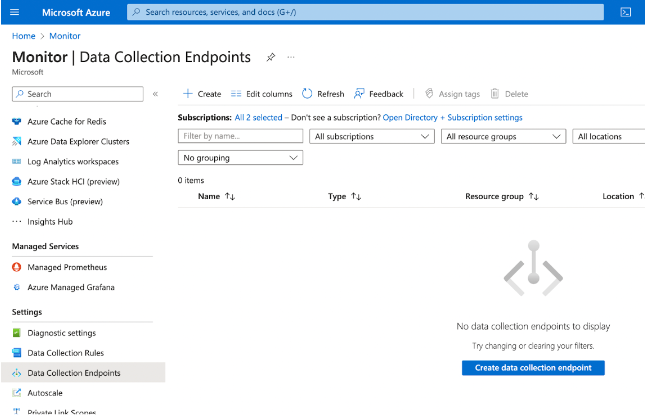
A prerequisite for the Logs Ingestion API is a DCE, which receives the log data from the script. Once the DCE is set up and connected to a data collection rule, data then transmits over HTTP. The Log Analytics workspace that receives the data must be in the same region as the DCE. To configure your new DCE, navigate to the Monitor page on the Azure Portal, then select Data Collection Endpoints.
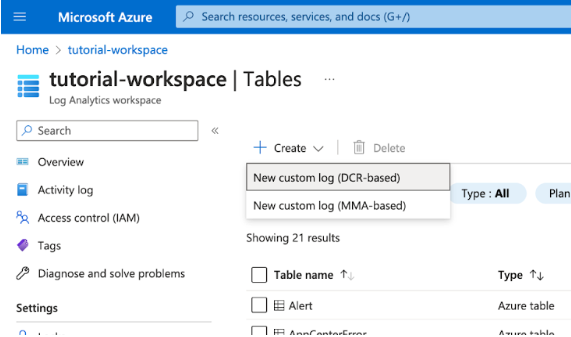
After creating the DCE, the next step is to add a custom log table where the data will reside. To do this, go through the following steps:
- Navigate to your Log Analytics workspace
- Select Tables
- Choose New custom log (DCR based).
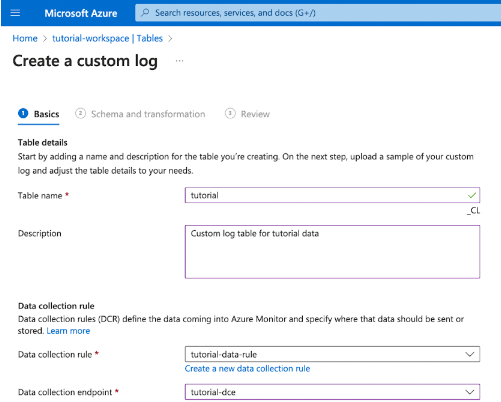
On the Create a custom log page, fill in the fields for table name, data collection rule and data collection endpoint. If you don’t have a DCR, click the prompt to create a data collection rule before proceeding.
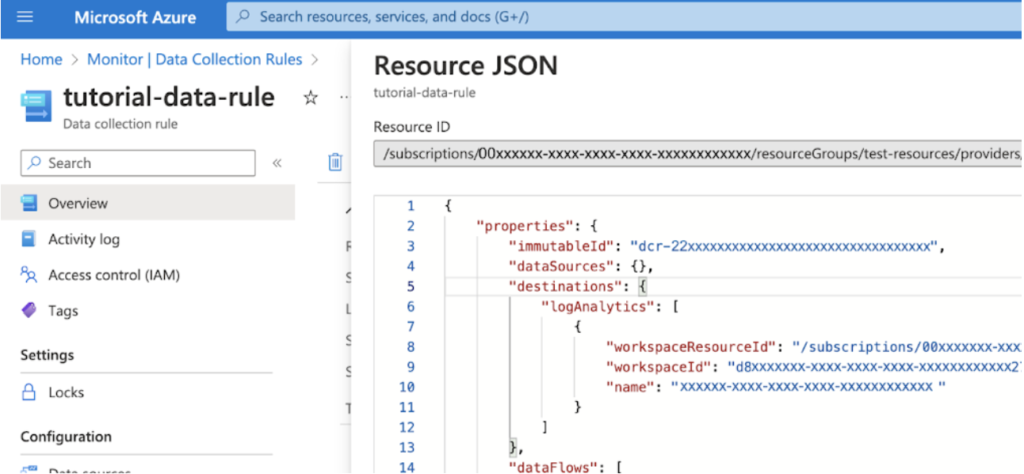
At this point, you have created your DCE, DCR and custom table. The next step is to copy the DCR immutableId. Navigate to the DCR on the portal and copy it from the resource JSON.
You can now send logs over HTTP with the Logs Ingestion API. To do this, send a POST request to the DCE. The endpoint URI should be formatted like the below example:
{Data Collection Endpoint URI}/dataCollectionRules/{DCR Immutable ID}/streams/{Custom Log Name}?api-version=2021-11-01-previewAfter making the POST request, your data will appear in the Log Analytics workspace, indicating successful log data ingestion. In the next section, we’ll see how to achieve this same goal with the Data Collector API.
HTTP Data Collector API
Any application that calls a REST API can use the HTTP Data Collector API to send log data to a Log Analytics workspace in Azure Monitor. For example, the application could be an Azure Automation runbook that gathers data from different cloud providers or a management system that uses Azure Monitor to collect and analyze log data.
How the HTTP Data Collector API works
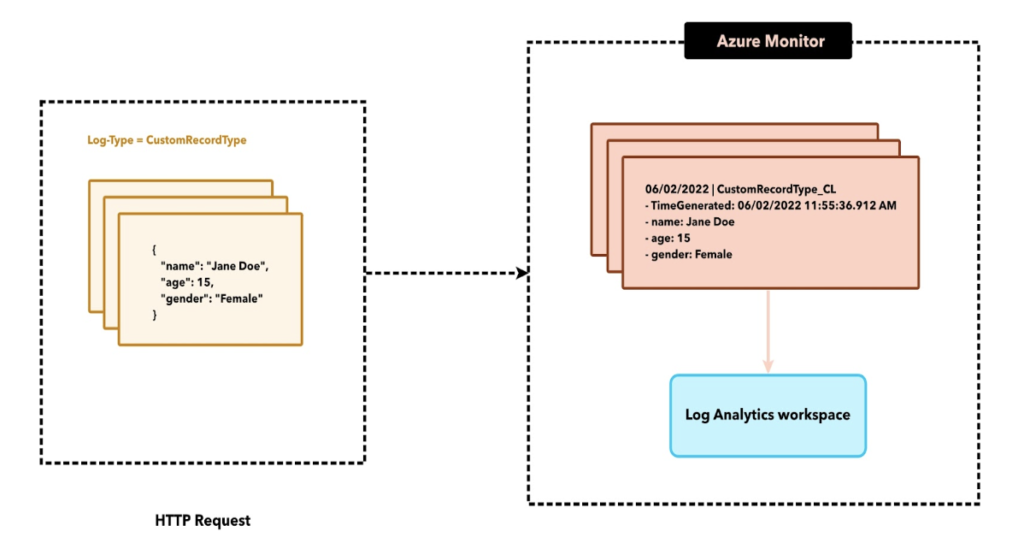
The Log Analytics workspace records all data under a specific record type. The HTTP Data Collector API then consumes your formatted data as a list of JSON records. As the data goes to the Log Analytics workspace, each record in the list becomes an individual entity.
How to use the HTTP Data Collector API
Using the HTTP Data Collector API entails creating and sending a POST request that includes the monitoring data in JSON format. The request endpoint is:
https://<WorkspaceId>.ods.opinsights.azure.com/api/logs?api-version=2016-04-01
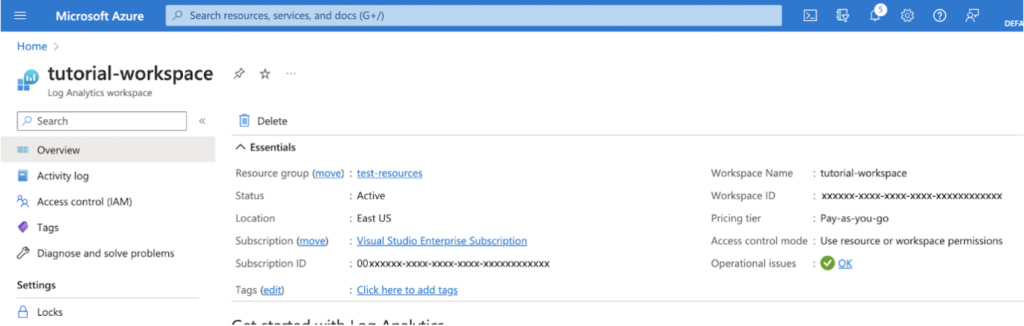
Next, send the data to the Log Analytics workspace using the Workspace ID unique identifier. You can find the Workspace ID from the Log Analytics workspace dashboard on the Azure Portal.
Use the SHA256 algorithm to sign a request with a workspace access key. By adding this signature to the authorization header of your API request, you authenticate your request to the API:
Authorization: SharedKey <WorkspaceID>:<Signature>
The message body must be in JSON, comprising at least one record with the property name and value pairs.
[{
"name": "Jane Doe",
"age": 15,
"gender": "Female"
},
{
"name": "John Doe",
"age": 19,
"gender": "Male"
}
]
Alternatives to the HTTP Data Collector API
As you gather data into Azure Logs, the HTTP Data Collector API should be able to handle the major use cases. However, some restrictions may arise that require a workaround. In these instances, you can adopt one of several options.
Application Insights and Custom Events
With scenarios where the SDK cannot fetch non-default application data (such as requests, dependencies, and exceptions), use Custom Events to send data using Application Insights. This aids in performing instrumentation through an application SDK.
Azure Data Explorer
For log data that requires more advanced ingestion or processing that Azure Monitor Logs doesn't support, the Azure Data Explorer is a great alternative. Azure Data Explorer powers Azure Monitor Logs and Application Insights Analytics. You are in total control over the cluster, retention rate, schema and other elements, helping you further customize your log management features. The diverse ingestion options include CSV, TSV and JSON files.
Log your data with CrowdStrike Falcon Next-Gen SIEM
Elevate your cybersecurity with the CrowdStrike Falcon® platform, the premier AI-native platform for SIEM and log management. Experience security logging at a petabyte scale, choosing between cloud-native or self-hosted deployment options. Log your data with a powerful, index-free architecture, without bottlenecks, allowing threat hunting with over 1 PB of data ingestion per day. Ensure real-time search capabilities to outpace adversaries, achieving sub-second latency for complex queries. Benefit from 360-degree visibility, consolidating data to break down silos and enabling security, IT, and DevOps teams to hunt threats, monitor performance, and ensure compliance seamlessly across 3 billion events in less than 1 second.