


![Helping Non-Security Stakeholders Understand ATT&CK in 10 Minutes or Less [VIDEO]](https://assets.crowdstrike.com/is/image/crowdstrikeinc/video-ATTCK2-1?wid=530&hei=349&fmt=png-alpha&qlt=95,0&resMode=sharp2&op_usm=3.0,0.3,2,0)
![Qatar’s Commercial Bank Chooses CrowdStrike Falcon®: A Partnership Based on Trust [VIDEO]](https://assets.crowdstrike.com/is/image/crowdstrikeinc/Edward-Gonam-Qatar-Blog2-1?wid=530&hei=349&fmt=png-alpha&qlt=95,0&resMode=sharp2&op_usm=3.0,0.3,2,0)


?wid=2048&hei=1350&fmt=png-alpha&qlt=95,0&resMode=sharp2&op_usm=3.0,0.3,2,0)


As of macOS 10.12 Sierra, incident responders have been able to turn to a new endpoint log source for investigative answers: the Apple Unified Log (AUL). This log format, standardized across the Apple ecosystem, is both a blessing and a curse for responders. While it boasts longer retention times and contains a tremendous amount of data, the volume and level of granularity can quickly become overwhelming. Hunting for useful entries in the AUL is like scouring the pages of a “Where’s Waldo?” children’s book, trying to find Waldo in crowds of similar faces.
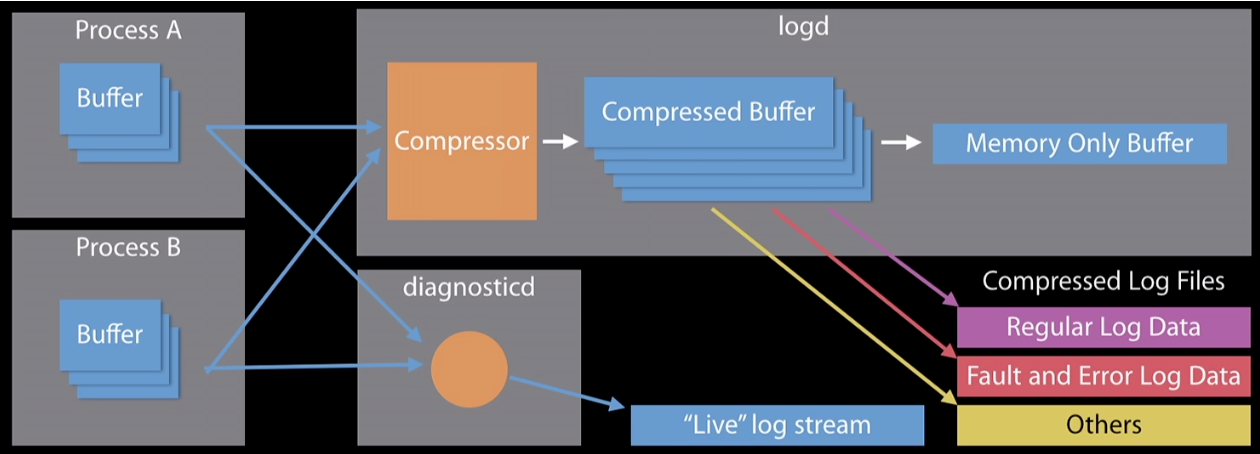 Figure 1: AUL architecture
Process A has a buffer of messages that it wants to log to disk. The logd daemon begins grabbing the messages from Process A’s buffer and compressing them into its own compressed buffer. The logd daemon then analyzes the message, checking to see which message level the logs are categorized as (Default, Info, Debug, Error or Fault). Depending on the message level, the logd daemon will either write to disk or write to memory (see Table 1).
Figure 1: AUL architecture
Process A has a buffer of messages that it wants to log to disk. The logd daemon begins grabbing the messages from Process A’s buffer and compressing them into its own compressed buffer. The logd daemon then analyzes the message, checking to see which message level the logs are categorized as (Default, Info, Debug, Error or Fault). Depending on the message level, the logd daemon will either write to disk or write to memory (see Table 1).
Table 2: Log fields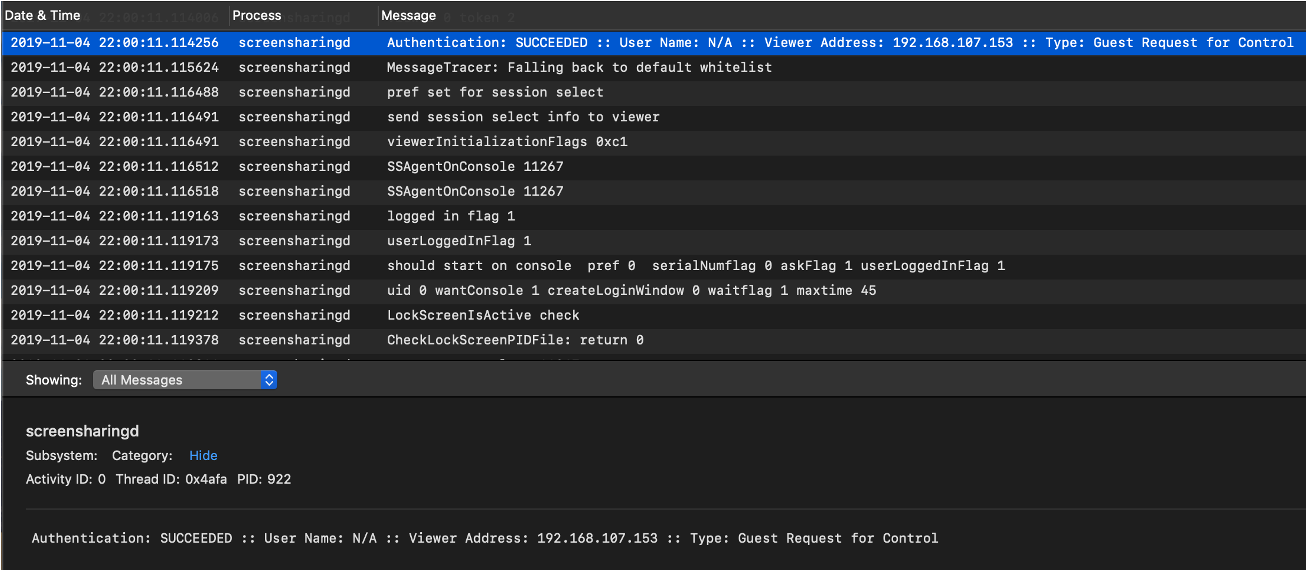 Figure 2: AUL example (click image to enlarge)
Table 3: Log source size comparison
Because of the sheer amount of data contained in the unified log, acquiring and parsing it for investigations is critical.
Acquiring and Parsing the Unified Log
The Apple Unified Log can be acquired from a live system and a forensic image. From a forensic image, a forensic analyst can reconstruct the log using the contents of the directories 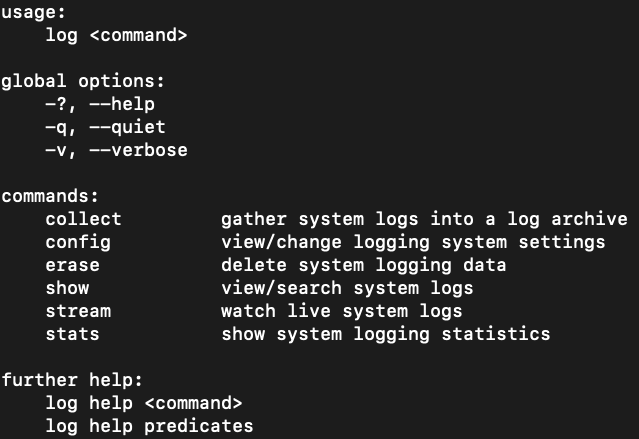 Figure 3: Log options
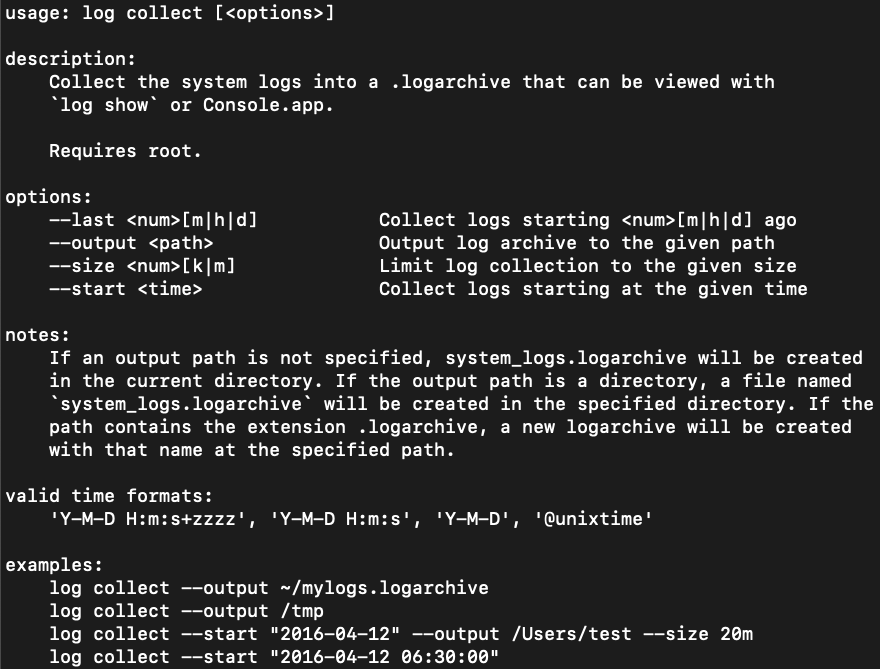 Figure 4:
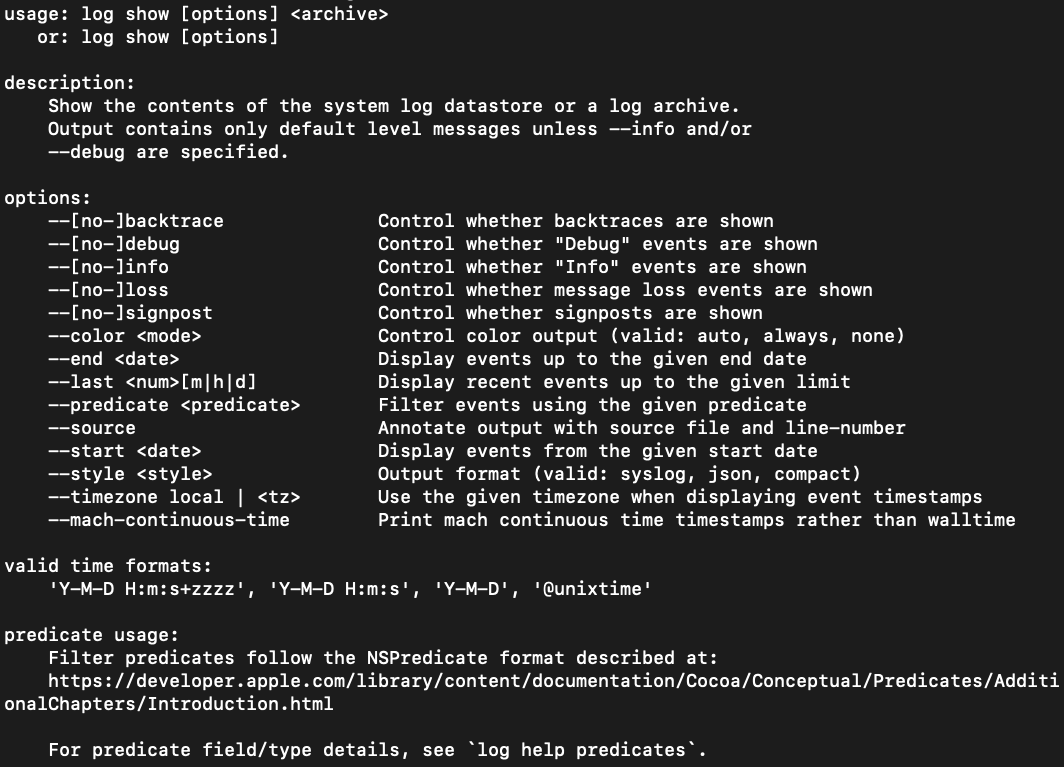 Figure 5:
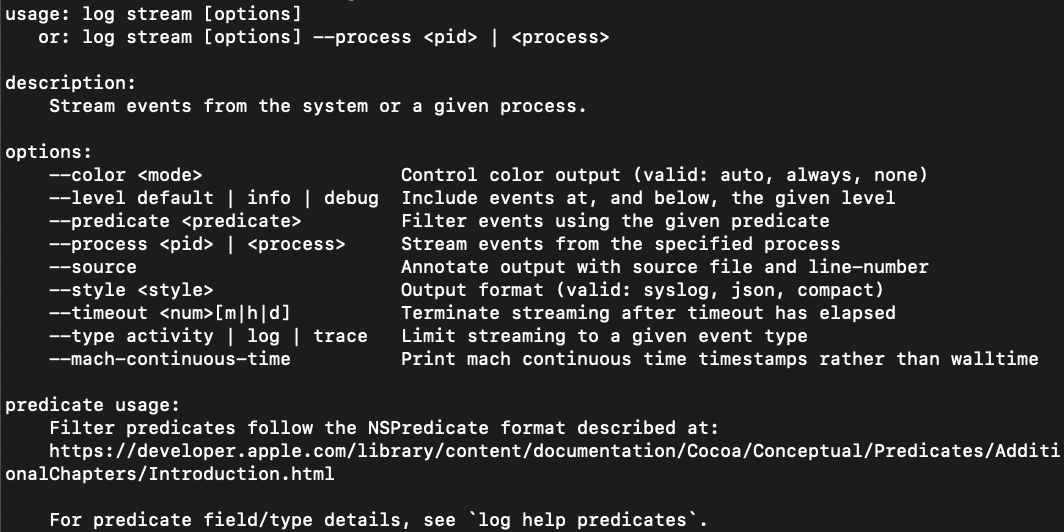 Figure 6:
After the AUL is captured from either a live system or forensic image, parsing it into a usable format for analysis is essential for performing a forensic investigation. CrowdStrike parsed a sample
Figure 6:
After the AUL is captured from either a live system or forensic image, parsing it into a usable format for analysis is essential for performing a forensic investigation. CrowdStrike parsed a sample
The options for 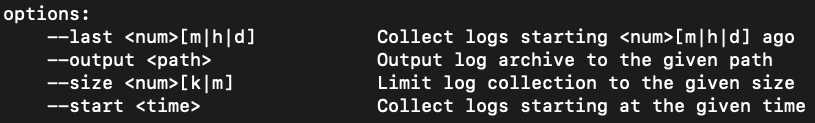 Figure 7:
The options for
Figure 7:
The options for 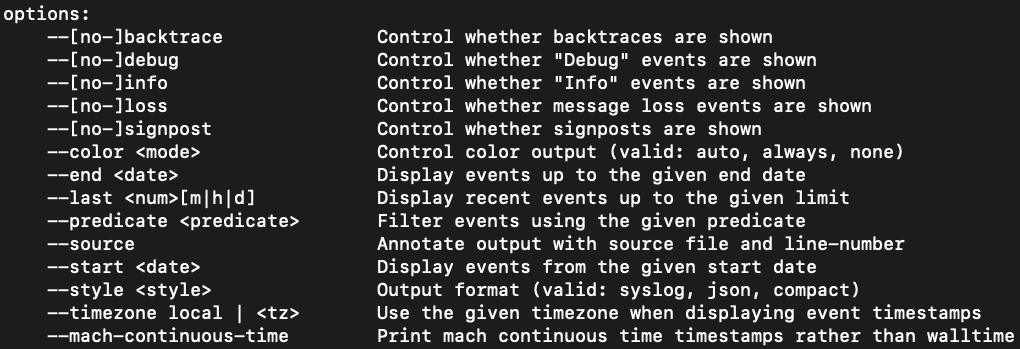 Figure 8:
Predicates can be specified on the command line when running either the
Table 4: Example predicates
While these predicates are a useful starting point to identify potentially malicious activity on a macOS system, forensic analysts can use known indicators of compromise to create specific predicate filters for investigations.
In this blog, we explain why it’s important for forensic analysts to understand why Apple implemented the AUL, how it works, what type of information it records and how to use it in order to have a better understanding of AUL data and the information analysts can find within.
Why Did Apple Implement the AUL?
Apple announced the AUL at its 2016 Worldwide Developers Conference (WWDC) with the goal of changing the way logging occurs across its devices. Prior to the AUL, macOS relied on traditional Unix logging formats such as the syslog or proprietary formats such as the Apple System Log (ASL). However, Apple wanted a single, standardized logging format across the macOS, iOS, tvOS and watchOS platforms.In order to accomplish this, Apple needed to revamp its current logging process, especially on macOS. The implementation of a new logging system allowed Apple to tailor its new logging format to its developers, as well as incorporate space-saving and privacy-focused logging improvements.
Apple emphasized debugging capabilities for developers, incorporating a system centered around different levels of logging and errors. Apple improved the compression of log data by transitioning to a binary log format, allowing for maximum information collection while minimizing the observer effect. Various legacy logging APIs were redirected to log to the AUL, including NSLog, asl and syslog.
However, not every legacy log file made it into the new AUL. Audit.log, System.log, Daily.out, Monthly.out, Yearly.out, Wifi.log, Install.log, Cups and Third-party Apps were among the logs that did not get redirected. These other logs still provide valuable information for forensic analysts.
How Does the AUL Work?
Location and Contents of the Apple Unified Log
Due to its unique binary structure, the AUL comprises multiple files. These files can be categorized into two groups:.tracev3 files, found in the /var/db/diagnostics directory, and support files, found in the /var/db/uuidtext directory.All information written to the log is given a message level determined by the API used. There are three basic message levels (Default, Info and Debug) and two special message levels (Fault and Error). Each message level has two characteristics that can be set: Is it enabled? Is it stored to disk or memory? Table 1 shows the standard behavior for when message levels are enabled and where they are stored.
| Message Level | Enabled | Destination |
| Default | Always | Disk |
| Info | Yes | Memory |
| Debug | No | N/A |
| Error | Always | Disk |
| Fault | Always | Disk |
Table 1: Messaging Levels
Apple Unified Log Architecture
The AUL has two methods of processing logs: writing to disk, leveraged by the logd daemon, and viewing in real time, leveraged by the diagnosticd daemon.Figure 1 illustrates the high-level overview of how the AUL works. Processes A and B are acting as generic processes that are active on a system and log to the AUL.
Figure 1: AUL architectureProcess B has a buffer of messages that a client wants to view “live.” The diagnosticd daemon begins grabbing the messages out of Process B’s buffer and displays them in real time to the client. This real-time capability is typically seen with the
log stream command, which is discussed later.
Apple Unified Log Structure
The AUL introduces subsystems and categories to its logging format. The subsystem is the overarching daemon that is writing to the log — for example,com.crowdstrike.falcon. The category represents different created categories within the subsystem — for example, falcon_detections and falcon_alerts. Both subsystems and categories can be used to filter messages in the AUL.
In addition to the subsystem and categories, the AUL has predetermined, extracted log fields. These log fields contain data that is collected and parsed in the AUL. Since the release of the AUL with macOS 10.12 Sierra, the number of log fields has grown from 16 to 27 in macOS 10.15 Catalina, as shown in Table 2. From a forensic standpoint, the most beneficial log fields are often the Date & Time, Process, and Message fields.
| 10.12 Sierra | 10.13 High Sierra | 10.14 Mojave | 10.15 Catalina | |
| Log Fields | 16 | 22 | 27 | 27 |
Apple Unified Log Example
Figure 2 is an example of an AUL event from a CrowdStrike-created scenario. The three columns shown are Date & Time, Process and Message. In addition to the three log fields, there are additional log fields that have been extracted (seen at the bottom of the image): Activity ID, Thread ID and PID. Additionally, there are fields for Subsystem and Category, but there is no data for those fields.Based on the Process and Date & Time fields, the screensharingd process was running on November 4, 2019, at 22:00:11. The Message field indicates that the Guest Request for Control was successful and originated from the IP address
192.168.107.153.
 Figure 2: AUL example (click image to enlarge)
Log Volume
The unified log saves a volume of data that is vastly larger than its predecessors, the Apple System Log (ASL) and system.log. Table 3 details a comparison of logging size differences between the three log sources.| AUL | ASL | system.log | |
| Retention Period | 28-30 days | Full set of data: 7 days Limited set of data: 1 year | 7-14 days |
| Number of Records | 30-50 million | 200K-500K | 200K-400K |
| Size of Data | Logarchive: 400-800 MB Plaintext: 2-9 GB | 40-60 MB | 30-60 MB |
How Is the AUL Used?
Acquiring and Parsing the Unified Log
The Apple Unified Log can be acquired from a live system and a forensic image. From a forensic image, a forensic analyst can reconstruct the log using the contents of the directories /private/var/db/diagnostics and /private/var/db/uuidtext. If the contents of both directories are placed into a single directory with a .logarchive extension appended to the name, the unified log can be exported and analyzed by another macOS system or commercial tools.
The log command provides several options for acquiring the AUL from a live system. The available set of options for the log command is shown in Figure 3.
Figure 3: Log optionsLog collect, as shown in Figure 4, creates a .logarchive file of the AUL from a live system that can be later analyzed on another macOS system or with commercial tools.
Figure 4: Log collect manualLog show, as shown in Figure 5, presents the contents of a system’s unified log in plaintext to stdout. This data can be redirected to a text file for analysis using a data analysis tool or text editor.
Figure 5: Log show manualLog stream, as shown in Figure 6, provides the unified log as it occurs in real time. This data can be useful if it is captured and analyzed in real time, but may not be useful during a forensic investigation when examining historical evidence.
Figure 6: Log stream manual.logarchive file using three different tools: macOS’s native log show, Blackbag Blacklight and Yogesh Khatri’s UnifiedLogReader.
While the native log show on macOS provided the greatest flexibility in terms of filtering capabilities, the other two tools evaluated provided benefits as well. Blacklight, a commercial forensics platform, provides support on both Windows and Linux, as well as the ability to easily integrate unified log analysis into the rest of a disk analysis workflow. UnifiedLogReader, an open source Python script, provides filtering capabilities as well as support on any platform that can run Python.
On a sample .logarchive file obtained from a macOS 10.14.6 forensic image, Blacklight and UnifiedLogReader parsed out the same number of events, 936,446. The native macOS command log show --info --signpost processed an additional six events. These six events were timesync records that related to system boot and system clock adjustment events. While the third-party tools did not capture these few additional records, the affected records are not largely impactful to an incident response investigation.
Finding Waldo
Filtering the incredible amount of data that the AUL provides is crucial to operationalizing it for an incident response investigation. Traditional log analysis methodologies call for providing search terms togrep and running it against the entire plaintext output of the log. For the AUL, this would involve running log show or log collect and redirecting the output to a text file that can easily take up gigabytes of space.
While this approach may work for Apple system.log files that are a few megabytes in size, running a grep command across gigabytes of plaintext output from the AUL can be extremely time-consuming and present practical challenges such as finding a suitable storage drive for the log file. These problems are only exacerbated when this approach is done at scale across tens or even hundreds of systems.
Time and Size-Based Filtering
Bothlog show and log collect provide time-based filtering options for collections on live systems; log show’s time-based filtering can be used for log archives as well. Log collect also provides an option to collect data from the log that matches a specific predetermined size.
| Time-based filtering can be very useful in scenarios in which an incident responder already has determined timeframe(s) of interest for an investigation and only needs data for that specific time range. |
log collect, as shown in Figure 7, allow for either --start or --last timestamps, depending on whether or not the user wishes to collect data for a time range relative to the present. The --size option allows for a log archive of a specific size to be created, if an analyst is looking for a sampling of the AUL. These options must be run on a live system.
Figure 7: Log collect optionslog show, as shown in Figure 8, allow for both --start and --end timestamps to allow for specific time slices. The options for log show can be run on either a live system or against a log archive file collected from a forensic image.
Figure 8: Log show optionsPredicate-Based Filtering
Some of the most powerful filtering available for the AUL is available through predicates, which are logical statements.
| Using predicates, forensic analysts can rapidly narrow down the entries in the unified log by focusing on processes or events that are likely to generate useful forensic artifacts. From these key entries, analysts can pivot their analyses based on indicators in the event messages or timeframes.
|
log show or log stream commands. Passing predicates on the command line for log show is shown below:
log show User1_unifiedLog.logarchive
--info --backtrace --debug --loss --signpost --style syslog --force --predicate 'eventMessage CONTAINS "remote"'
> AUL_User1_remote.txt
While there is a large number of combinations of predicates that can be used when filtering the unified log, CrowdStrike has identified a few examples that can provide quick, critical insight when performing an incident response investigation. These predicates are detailed in Table 4.
| Predicate | Description |
| process == “sudo” | Captures command line activity run with elevated privileges
|
| process == “logind” | Captures user login events |
| process == "tccd" | Captures events that indicate permissions and access violations
|
| process == "sshd”
| Captures successful, failed and general ssh activity |
| process == "kextd" && sender == "IOKit” | Captures successful and failed attempts to add kernel extensions
|
| process == "screensharingd || process == "ScreensharingAgent”’
| Captures events that indicate successful or failed authentication via screen sharing |
| process == "loginwindow" && sender == "Security" | Captures keychain.db unlock events |
| process == "securityd" && eventMessage CONTAINS "Session " && subsystem == "com.apple.securityd"
| Captures session creation and destruction events |
Conclusion
The Apple Unified Log is a very useful log source that can provide forensic analysts with deep insight into activity that occurred on a system during a security incident. By leveraging the proper tools and procedures to capture, parse and filter the data, analysts can operationalize the data within to conduct more effective macOS incident response investigations.Additional Resources
- Learn more about the CrowdStrike Services team and how it can help your organization improve your cybersecurity readiness by visiting the webpage.
- Read about the powerful CrowdStrike Falcon® platform by visiting the webpage.
- Test CrowdStrike next-gen AV for yourself. Start your free trial of Falcon Prevent™ today.