


![Helping Non-Security Stakeholders Understand ATT&CK in 10 Minutes or Less [VIDEO]](https://assets.crowdstrike.com/is/image/crowdstrikeinc/video-ATTCK2-1?wid=530&hei=349&fmt=png-alpha&qlt=95,0&resMode=sharp2&op_usm=3.0,0.3,2,0)
![Qatar’s Commercial Bank Chooses CrowdStrike Falcon®: A Partnership Based on Trust [VIDEO]](https://assets.crowdstrike.com/is/image/crowdstrikeinc/Edward-Gonam-Qatar-Blog2-1?wid=530&hei=349&fmt=png-alpha&qlt=95,0&resMode=sharp2&op_usm=3.0,0.3,2,0)


?wid=2048&hei=1350&fmt=png-alpha&qlt=95,0&resMode=sharp2&op_usm=3.0,0.3,2,0)


At CrowdStrike, we’ve seen a moderate increase in Java-based malware recently, with Remote Access Tools (RATs) like Adwind becoming increasingly prevalent. Reverse engineering Java is typically very straightforward, since excellent Java binary decompilers have existed for years. Tools like JD-GUI make Java analysis a breeze and do an excellent job at recovering Java binaries’ source code (minus the comments). In cases where we need to dynamically debug Java programs, decompiled Java can be exported from the decompiler and then imported into a Java IDE like Eclipse as part of a new Java project. This allows us to build a project using the decompiled code and then dynamically debug it through the IDE. However, this all goes out the window when dealing with Java bytecode-based obfuscation, as most Java IDEs won’t compile raw JVM instructions, nor allow you to step through these instructions without the original source code.
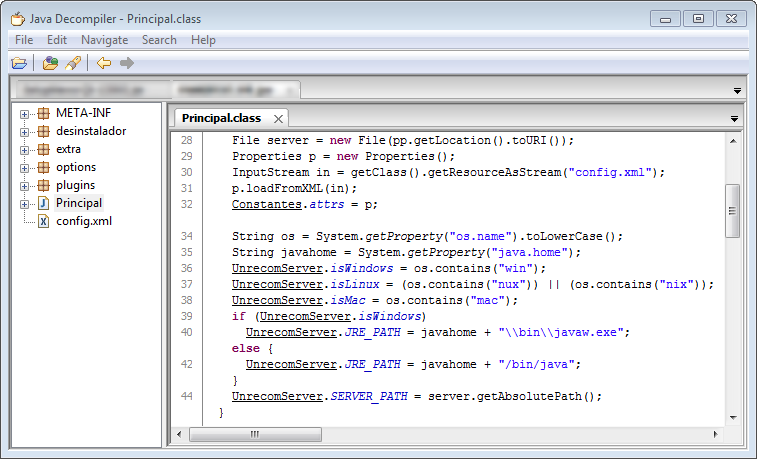
Decompiled Non-Obfuscated Java
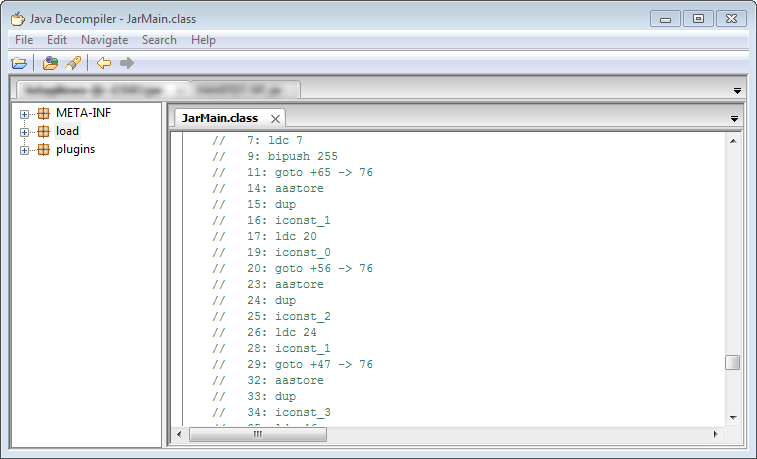
Decompiled Obfuscated Java
The best solution we’ve found for debugging malware’s native Java bytecode is Dr. Garbage’s Bytecode Visualizer. We haven’t seen any thorough walkthroughs on installing and using Bytecode Visualizer, so this blog entry serves as a step-by-step guide on how to dynamically analyze native Java bytecode with Bytecode Visualizer:
1. Install the Java SE JDK
The Java Standard Edition Development Kit can be downloaded from Oracle’s website at http://www.oracle.com/technetwork/java/javase/downloads/index.html. JDK 7 is currently the latest version and can be downloaded directly from http://www.oracle.com/technetwork/java/javase/downloads/jdk7-downloads-1880260.html.
During the JDK installation, be sure to have the JDK installer install the Public JRE as well if it isn’t already installed:
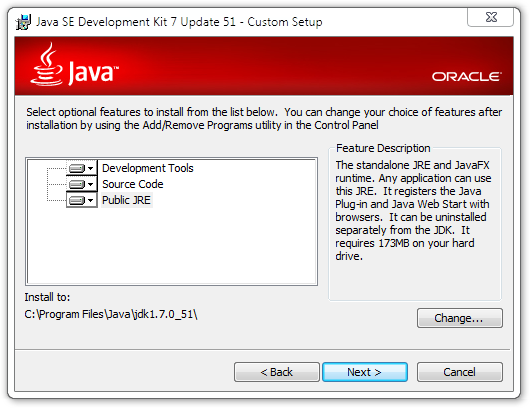
Installation Options
2. Install Eclipse
The Eclipse IDE for Java Developers can be downloaded from https://www.eclipse.org/downloads/packages/eclipse-ide-java-developers/keplersr1 (the download links are on the right side of the page).
3. Install Bytecode Visualizer
Run Eclipse and in the menu bar go to Help → Eclipse Marketplace…
In the Search tab of Eclipse Marketplace window, type “Dr. Garbage” into the Find textbox and press the Go button:
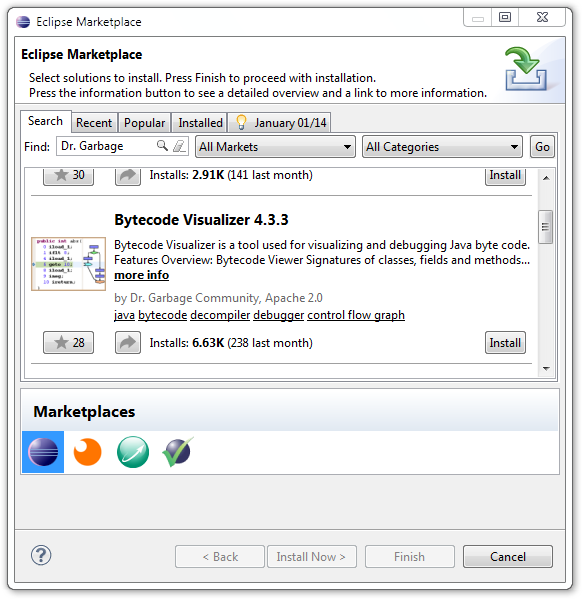
Eclipse Marketplace
Scroll to Bytecode Visualizer and press the Install button. Once installation is completed, restart Eclipse when prompted.
4. Load the JAR to be Analyzed
Once Eclipse restarts, close the Welcome tab, and in the menu bar go to File → New → Java Project. Specify any project name you like and press the Next button:
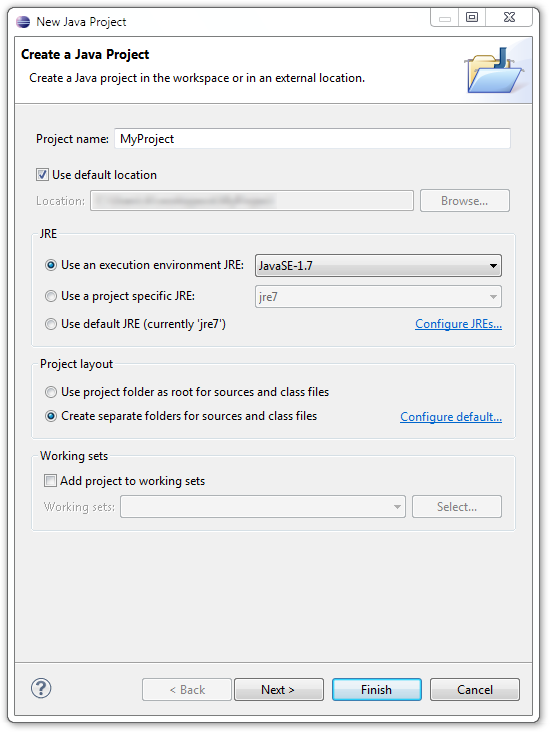
Create a Java Project
In the Java Settings window, click the Libraries tab. In the Libraries tab, press the Add External JARs button and select the JAR file you want to debug, thereby adding it to the Java project’s build path:
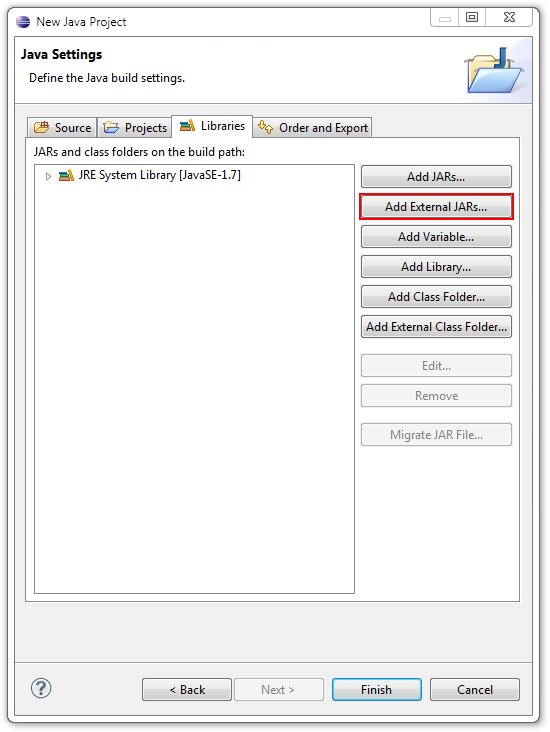
Java Settings
Once the JAR has been added to the build path, press the Finish button.
5. Open the JAR’s Code with Bytecode Visualizer
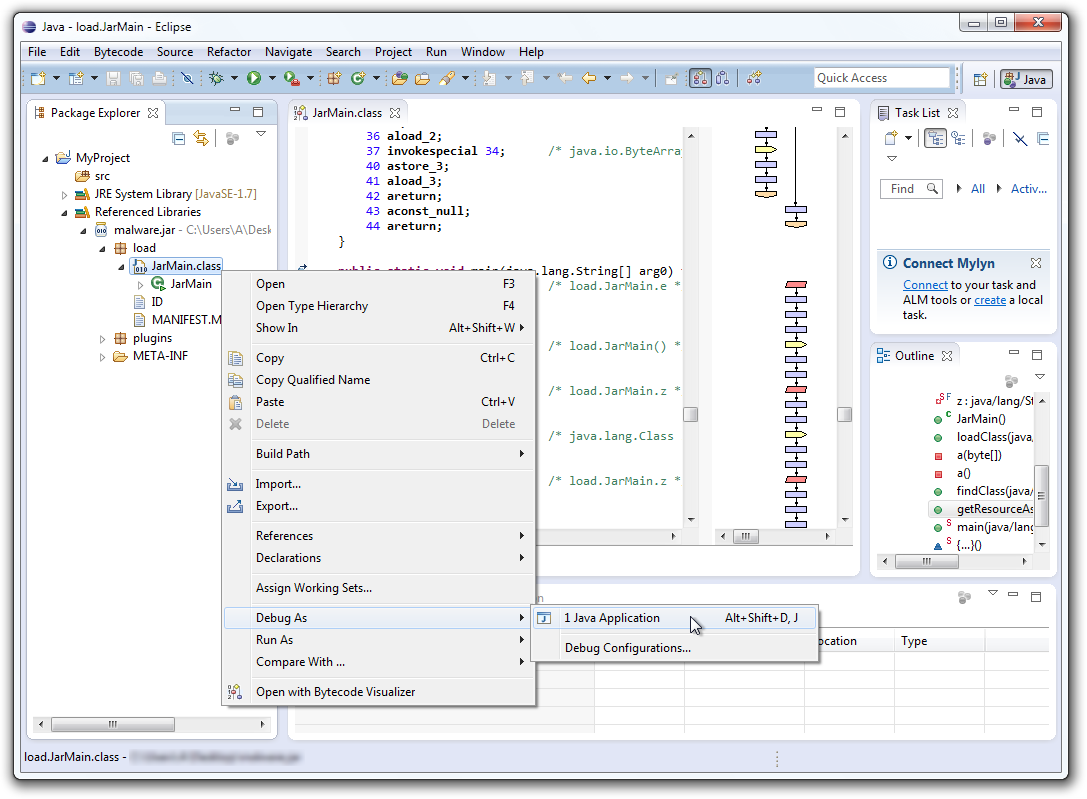
In the Package Explorer tab, expand your project’s Referenced Libraries to find your JAR file. Right-click on the class you want to debug and select Open with Bytecode Visualizer:
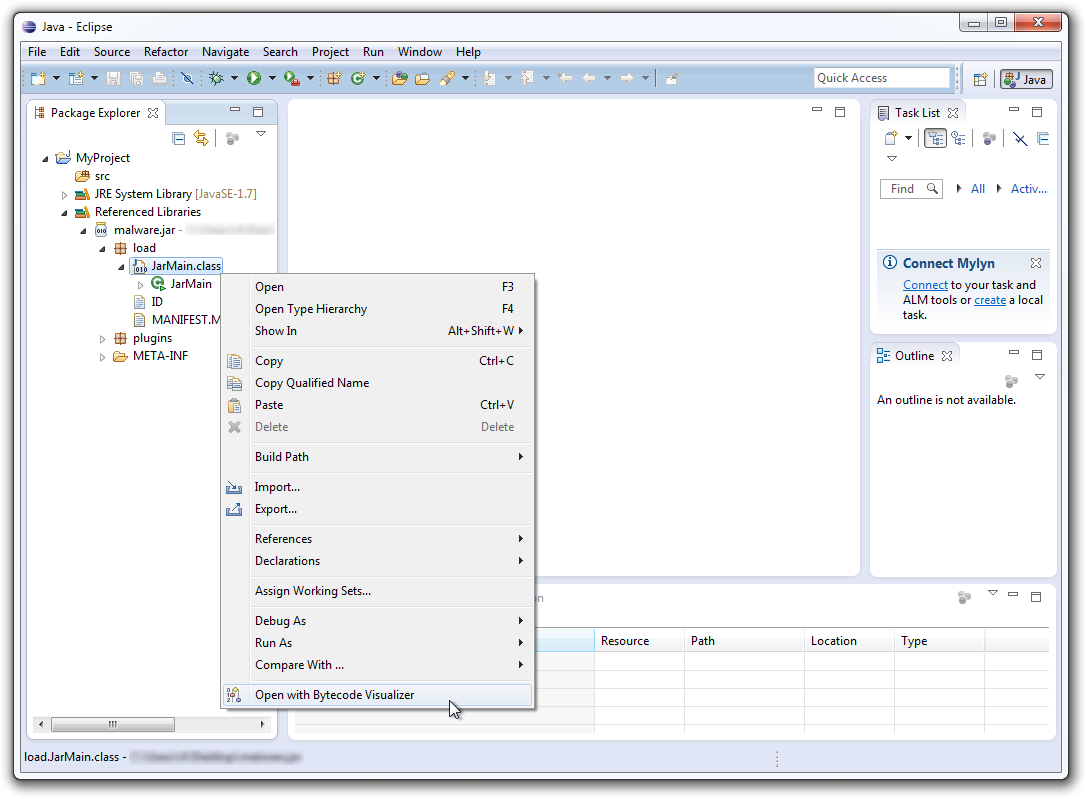
Open with Bytecode Visualizer
6. Set Breakpoints
With the JAR’s code now visible in Bytecode Visualizer, you can set breakpoints by double-clicking on the vertical gray bar to the left of the disassembled Java code:
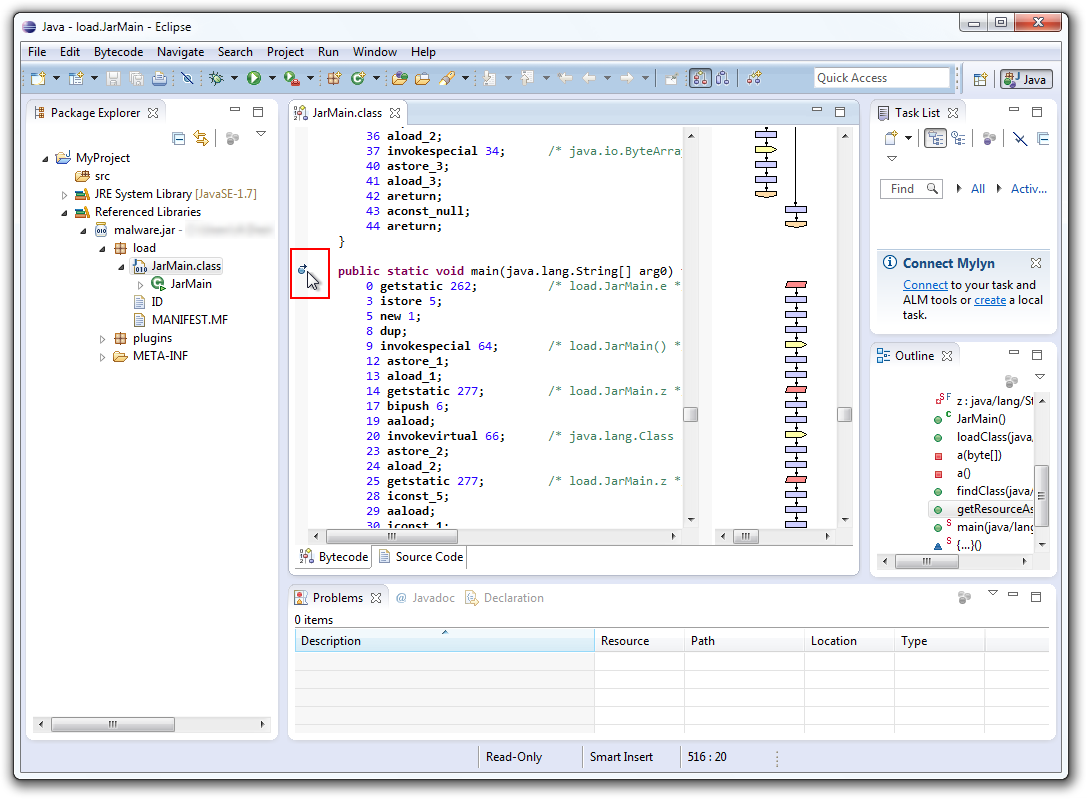
Setting a Breakpoint
Note that Bytecode Visualizer only allows you to set breakpoints on method entrypoints (the first instruction of a method); you can’t set breakpoints on arbitrary instructions.
7. Debugging the Disassembled Code
You can now run the disassembled code by right-clicking on the class you want to debug and choosing Debug As → Java Application:
Debug as Java Application
In the Debug perspective view, there are buttons to Step Into Bytecode and Step Over Bytecode (circled in red below). Use the Step Over Bytecode button to perform standard single-stepping; use the Step Into Bytecode button only to step into calls. The Debug perspective also allows you to see local variable in the Variables tab, and to add your own watches in the Expressions tab (you can add this tab via Window → Show View → Expressions in the menu bar); you can see below that I added a watch/expression for variable b:
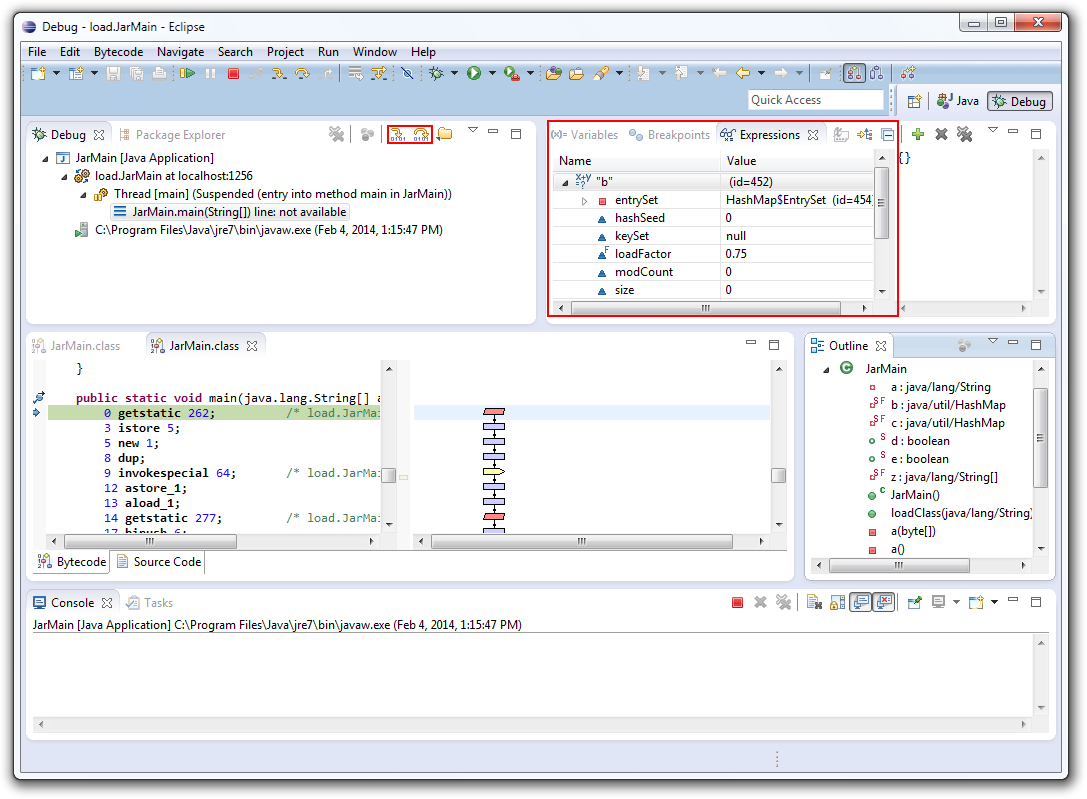
Debug Perspective
As far as we’ve seen, Bytecode Visualizer does not offer a view of the raw JVM stack, but even without it, tracing the code flow via single-stepping and examining memory with the Variables and Expressions tabs should typically allow you to successfully debug your target as needed.
For more information on Java-based malware or the adversaries using it, including detection logic or any of the adversaries tracked by CrowdStrike, please contact: intelligence@crowdstrike.com and inquire about our Intelligence subscription. To get full access to CrowdStrike's next-gen antivirus solution for 15 days visit the Falcon Prevent free trial page.