In the previous section of this series, we covered what an enterprise ought to look for in a centralized logging system that integrates with Kubernetes. A Kubernetes cluster comprises multiple components, each one generating logs. Even for moderately complex applications, the number of logs generated across pods can be too much to handle for effective querying or analysis. Therefore, it is essential to set up a standardized logging system that can handle different types of logs and scale as the load on a Kubernetes cluster changes.
In this section, we’ll explore the high-level architecture of a centralized logging system and demonstrate the use of CrowdStrike Falcon LogScale as a logging backend on a cluster running a microservice-backed application.
Learn More
Explore the complete Kubernetes Logging Guide series:
- Part 1: The Basics
- Part 2: Advanced Concepts
- Part 3: Centralizing Kubernetes Logs
- Part 4: Centralized Logging in a Kubernetes Cluster
Leveraging a centralized logging architecture
The dynamic nature of Kubernetes workloads highlights the significance of logging and monitoring. The persistence of application logs is linked to the lifecycle of the containers, pods, or nodes running them. Therefore, it is easier to identify issues, derive metrics, and discover security threats with a centralized logging and monitoring system. Logs across different nodes are collected by a log shipper, such as FluentD or Falcon LogScale Collector, then pushed to a centralized logging backend for aggregation and analysis.
Several logging backends lack the critical features expected from a centralized log management and observability platform. For example, some platforms allow scalable data ingestion but do not provide robust log search and discovery tools. CrowdStrike Falcon LogScale is an excellent log management tool for ingesting, searching, transforming, and archiving your log data.
In the remainder of this post, we will learn how to ship logs from a Kubernetes cluster to LogScale.
Sending logs from Kubernetes to LogScale
In this brief walkthrough, we will spin up a Kubernetes cluster and deploy a microservice-backed application. Then, we’ll configure our cluster to ship logs to LogScale.
Prerequisites
- Install minikube, which we’ll use to run a local Kubernetes cluster.
- Install kubectl, the Kubernetes command-line tool.
- Install Helm, the package manager for Kubernetes.
- Clone the microservices-demo repository for Sock Shop.
Create a Kubernetes cluster
First, we will use minikube to spin up a Kubernetes cluster. We are essentially following these steps for deploying Sock Shop on minikube.
~/microservices-demo$ minikube start
After a few moments, our cluster is up and running.
…Done! kubectl is now configured to use "minikube" cluster and "default" namespace by default
Deploy Sock Shop to our cluster
With our cluster up and running, we can deploy the entire application, which is defined in files in the deploy/kubernetes/manifests folder of the repository.
~/microservices-demo$ kubectl create -f deploy/kubernetes/manifestsnamespace/sock-shop created


Warning: spec.template.spec.nodeSelector[beta.kubernetes.io/os]: deprecated since v1.14; use "kubernetes.io/os" instead


deployment.apps/carts created


service/carts created


deployment.apps/carts-db created


service/carts-db created


deployment.apps/catalogue created


service/catalogue created


deployment.apps/catalogue-db created


service/catalogue-db created


deployment.apps/front-end created


service/front-end created


deployment.apps/orders created


service/orders created


deployment.apps/orders-db created


service/orders-db created


deployment.apps/payment created


service/payment created


deployment.apps/queue-master created


service/queue-master created


deployment.apps/rabbitmq created


service/rabbitmq created


deployment.apps/session-db created


service/session-db created


deployment.apps/shipping created


service/shipping created


deployment.apps/user created


service/user created


deployment.apps/user-db created


service/user-db created
After deploying our application, we can check the status of the pods to ensure the entire application is up and running:
~/microservices-demo$ kubectl get pods --namespace=sock-shopNAME                           READY   STATUS    RESTARTS   AGE


carts-76dd6bf8f9-xxnf6         1/1     Running   0          2m25s


carts-db-775b544b45-f8h2c      1/1     Running   0          2m25s


catalogue-5f495f9cf8-55zf9     0/1     Running   0          2m25s


catalogue-db-6d49c7c65-5ftrf   1/1     Running   0          2m25s


front-end-6585d48b5c-rlhwg     1/1     Running   0          2m24s


orders-5d8557969c-nlzb8        1/1     Running   0          2m24s


orders-db-784fc9d845-7hct5     1/1     Running   0          2m24s


payment-f86459795-xq4br        0/1     Running   0          2m24s


queue-master-fc75dcdd6-rzgzw   1/1     Running   0          2m24s


rabbitmq-8d7575749-td9cq       2/2     Running   0          2m24s


session-db-5b7f5f6c47-sqzq2    1/1     Running   0          2m24s


shipping-85bcbcdf77-ld99x      1/1     Running   0          2m23s


user-65dcdb777-qv7qn           0/1     Running   0          2m23s


user-db-5569d9d7f5-tntvd       1/1     Running   0          2m23s
We can also see information about the services in our cluster:
~/microservices-demo$ kubectl get services --namespace=sock-shopNAME         TYPE       CLUSTER-IP      EXTERNAL-IP PORT(S)            AGE


carts        ClusterIP  10.111.90.39    <none>      80/TCP             2m27s


carts-db     ClusterIP  10.99.254.88    <none>      27017/TCP          2m27s


catalogue    ClusterIP  10.105.30.13    <none>      80/TCP             2m27s


catalogue-db ClusterIP  10.110.239.255  <none>      3306/TCP           2m27s


front-end    NodePort   10.99.22.46     <none>      80:30001/TCP       2m26s


orders       ClusterIP  10.97.216.139   <none>      80/TCP             2m26s


orders-db    ClusterIP  10.99.167.28    <none>      27017/TCP          2m26s


payment      ClusterIP  10.97.239.135   <none>      80/TCP             2m26s


queue-master ClusterIP  10.103.237.160  <none>      80/TCP             2m26s


rabbitmq     ClusterIP  10.109.73.22    <none>      5672/TCP,9090/TCP  2m26s


session-db   ClusterIP  10.104.182.35   <none>      6379/TCP           2m26s


shipping     ClusterIP  10.106.124.181  <none>      80/TCP             2m26s


user         ClusterIP  10.101.205.201  <none>      80/TCP             2m26s


user-db      ClusterIP  10.98.50.126    <none>      27017/TCP          2m26s
Next, we get the IP address of our cluster.
~/microservices-demo$ minikube ip192.168.49.2
Note that the IP address for your local cluster may be different. For our example, we will use 192.168.49.2. The front-end service exposes its port 80 to port 30001 of our minikube cluster. Therefore, we can visit 192.168.49.2:30001 in our browser to see our application:
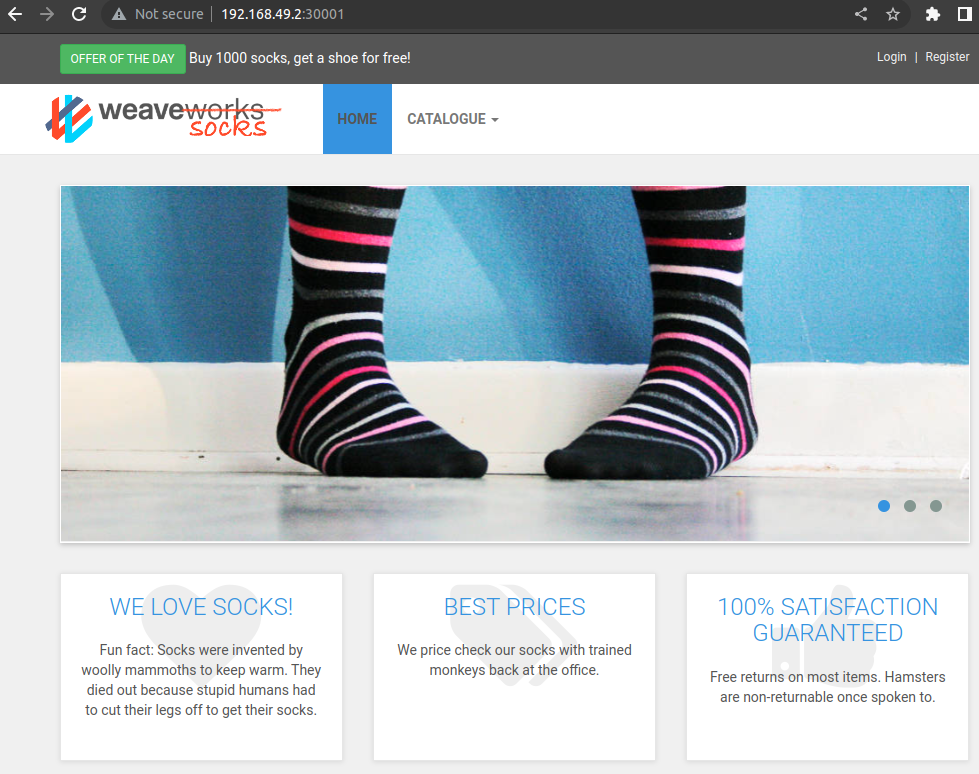
It works! Now that our application is up and running in Kubernetes, we can set up our cluster to ship its logs to LogScale.
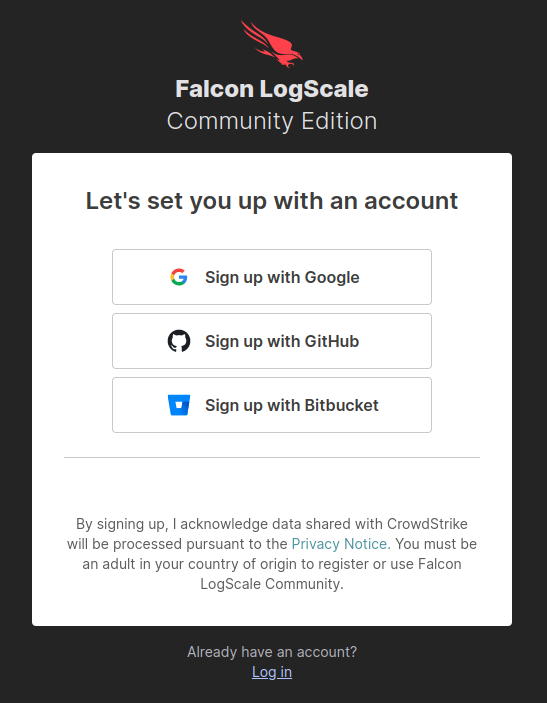
Obtain your LogScale URL and ingest token
To ship our Kubernetes logs to LogScale, we will need a log repository and an ingest token. If you don’t have an account with LogScale, you can sign up for a free Community Edition account.
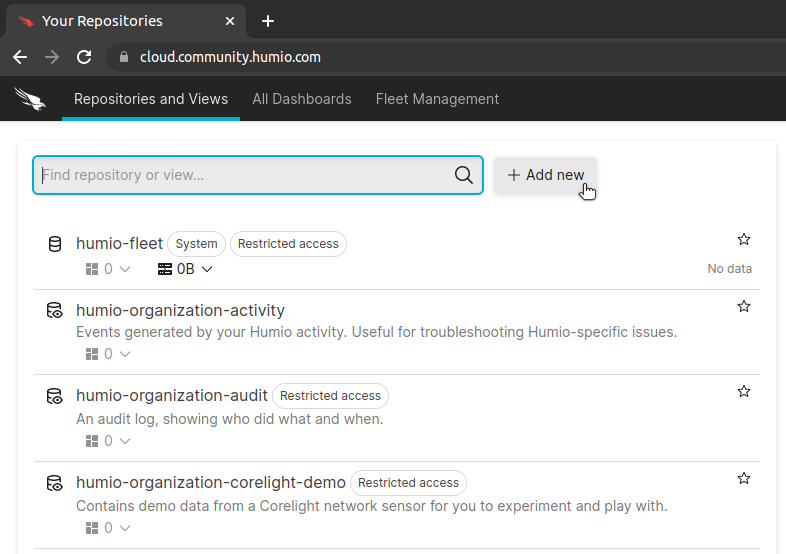
After you have logged in, click on + Add new to create a new log repository.
After you have created your repository, go to Settings > Ingest Tokens.
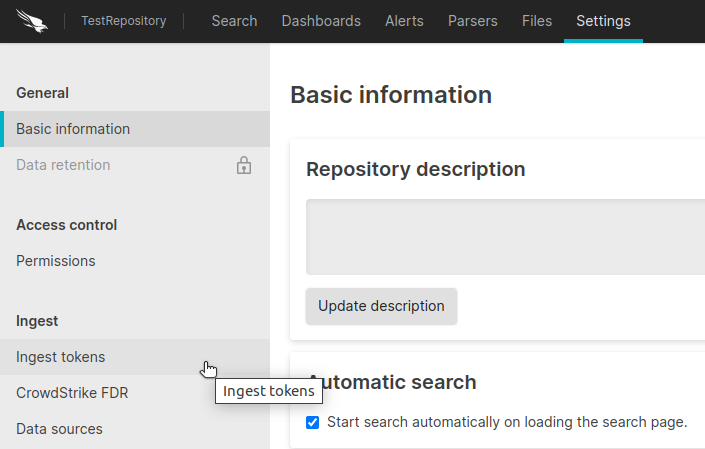
When sending log data to LogScale, your log shipper uses an ingest token to authenticate its requests. On the Ingest Tokens page, click on Add Token.
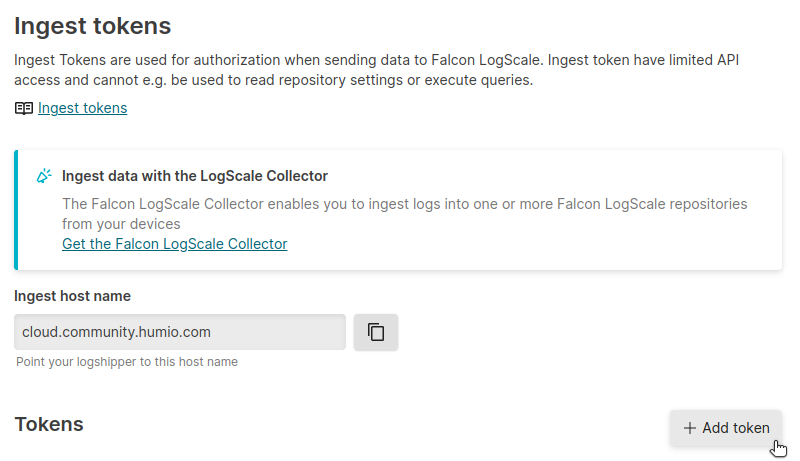
Copy down the value of your newly created ingest token. You’ll use it momentarily.
Update the main Helm chart repository
Our Kubernetes cluster will use Fluent Bit to ship its log to LogScale. Our setup of this log shipper will generally follow the instructions here.
First, we make sure that our Helm charts are up-to-date.
~/microservices-demo$ helm repo addhumio https://humio.github.io/humio-helm-charts
~/microservices-demo$ helm repo update
Configure the Fluent Bit log shipper
We configure the Fluent Bit log shipper by creating a file called humio-agent.yaml. It should have the following contents:
humio-fluentbit:enabled: true


humioHostname: $YOUR_LOGSCALE_URL


es:


tls: true


parserConfig: |-


[PARSER]


Name cri


Format regex


Regex ^(?<time>[^ ]+) (?<stream>stdout|stderr) (?<logtag>[^ ]*) (?<log>.*)$


Time_Key time


Time_Format %Y-%m-%dT%H:%M:%S.%L%z


inputConfig: |-


[INPUT]


Name             tail


Path             /var/log/containers/*.log


Parser           cri


Tag              kube.*


Refresh_Interval 5


Mem_Buf_Limit    256MB


Skip_Long_Lines  On
Replace $YOUR_LOGSCALE_URL with the Falcon LogScale URL endpoint that corresponds with your account type. For example, if you are using CrowdStrike Falcon LogScale Community Edition, then your URL will be cloud.community.humio.com.
Install the Helm chart
With our configuration file complete, we create a new logging namespace and install the Helm chart with the following commands. We make sure to replace $YOUR_LOGSCALE_INGEST_TOKEN with our newly created ingest token from LogScale.
~/microservices-demo$ kubectl create namespace logging~/microservices-demo$ helm install humio humio/humio-helm-charts


--namespace logging


--set humio-fluentbit.token=$YOUR_LOGSCALE_INGEST_TOKEN


--values humio-agent.yaml


NAME: humio


LAST DEPLOYED: Mon Feb 20 09:15:47 2023


NAMESPACE: logging


STATUS: deployed


REVISION: 1


TEST SUITE: None
With the log shipper installed and running, our logs will begin shipping to LogScale.
Verify log ingestion at LogScale
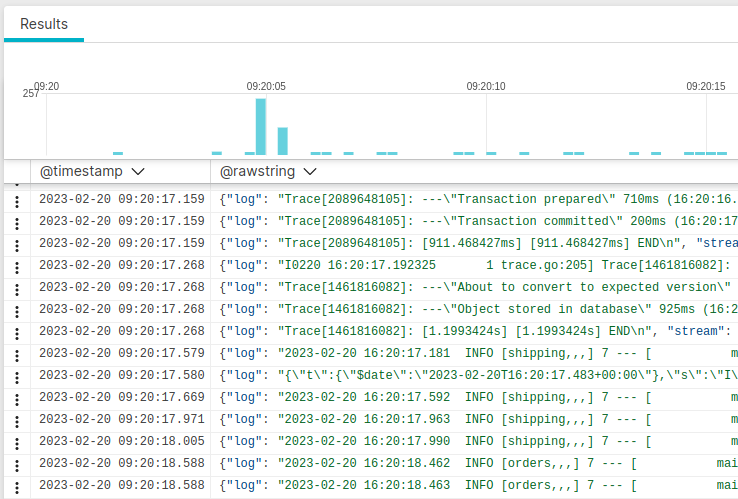
Returning to our LogScale dashboard, we navigate to our test repository and see that log data has begun to arrive.
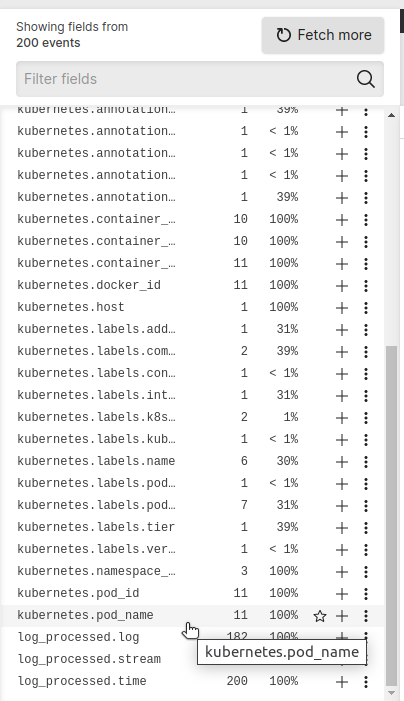
The log shipper parses all of our Kubernetes log entries, and LogScale uses the parsed fields to enable easy querying and analysis. For example, we can filter all of our log entries by Kubernetes pod name:
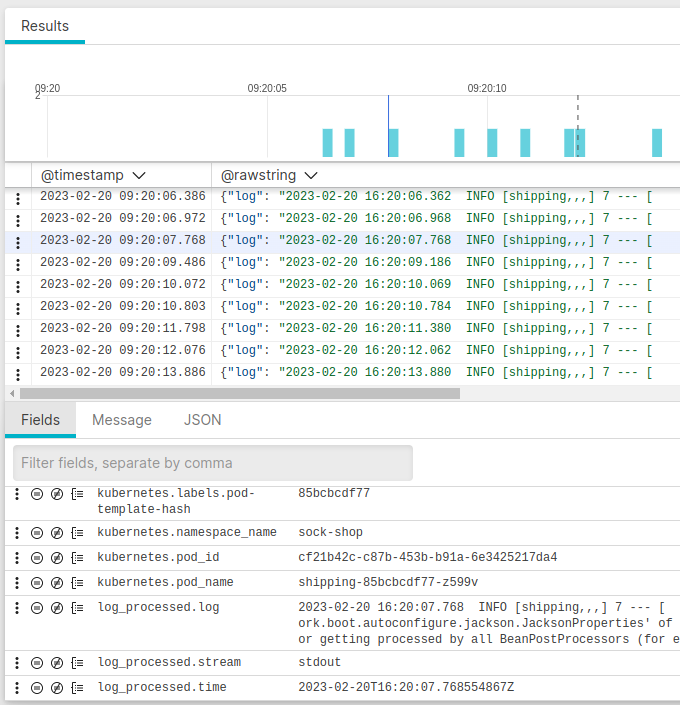
This shows us which entries are associated with a pod name. We can select a specific pod name. For example, we may want to see all logs associated with our shipping service pod.
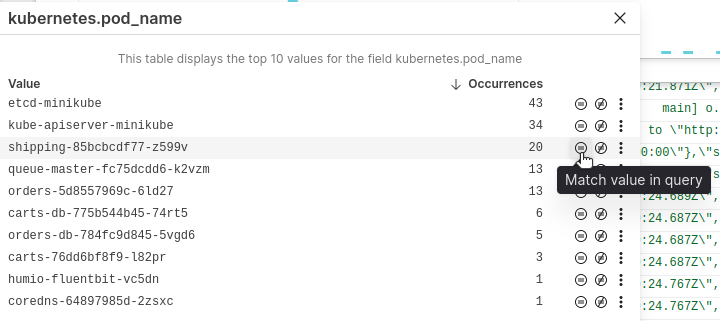
The results of the query show log entries from that specific Kubernetes pod.
You can learn about how to use LogScale even more effectively with querying functions and automated alerts.
Tear it all down
Now that we’ve shown how to get our Kubernetes cluster logs to LogScale, let’s remember to tear everything down.
~/microservices-demo$ helm uninstall humio/humio-helm-charts--namespace logging
~/microservices-demo$ kubectl delete namespace logging --cascade=background
~/microservices-demo$ kubectl delete -f deploy/kubernetes/manifests
~/microservices-demo$ minikube delete
Log your data with CrowdStrike Falcon Next-Gen SIEM
Elevate your cybersecurity with the CrowdStrike Falcon® platform, the premier AI-native platform for SIEM and log management. Experience security logging at a petabyte scale, choosing between cloud-native or self-hosted deployment options. Log your data with a powerful, index-free architecture, without bottlenecks, allowing threat hunting with over 1 PB of data ingestion per day. Ensure real-time search capabilities to outpace adversaries, achieving sub-second latency for complex queries. Benefit from 360-degree visibility, consolidating data to break down silos and enabling security, IT, and DevOps teams to hunt threats, monitor performance, and ensure compliance seamlessly across 3 billion events in less than 1 second.
Arfan Sharif is a product marketing lead for the Observability portfolio at CrowdStrike. He has over 15 years experience driving Log Management, ITOps, Observability, Security and CX solutions for companies such as Splunk, Genesys and Quest Software. Arfan graduated in Computer Science at Bucks and Chilterns University and has a career spanning across Product Marketing and Sales Engineering.