Endpoint Security
CrowdStrike Tech Hub
Your ultimate resource for the CrowdStrike Falcon® platform: In-depth videos, tutorials, and training.
Select a product category below to get started.
Latest videos
Endpoint Security - Real Time Response
Play Video
Endpoint Security - Automated Remediation
Play Video
Endpoint Security - Falcon Fusion with Real Time Response
Play Video
Endpoint Security - Customized Dashboards
Play Video
Endpoint Security - Context Enrichment
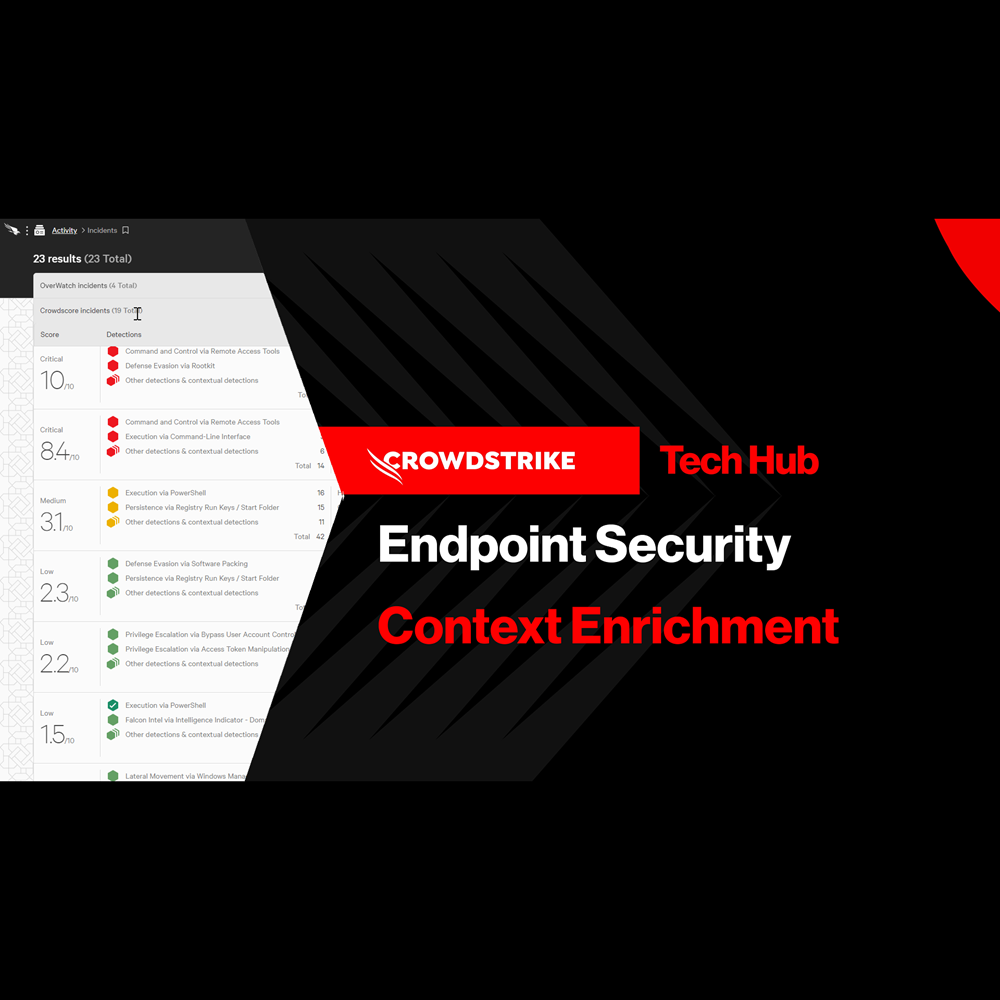
Play Video
Endpoint Security - Falcon Go for Small and Medium Businesses
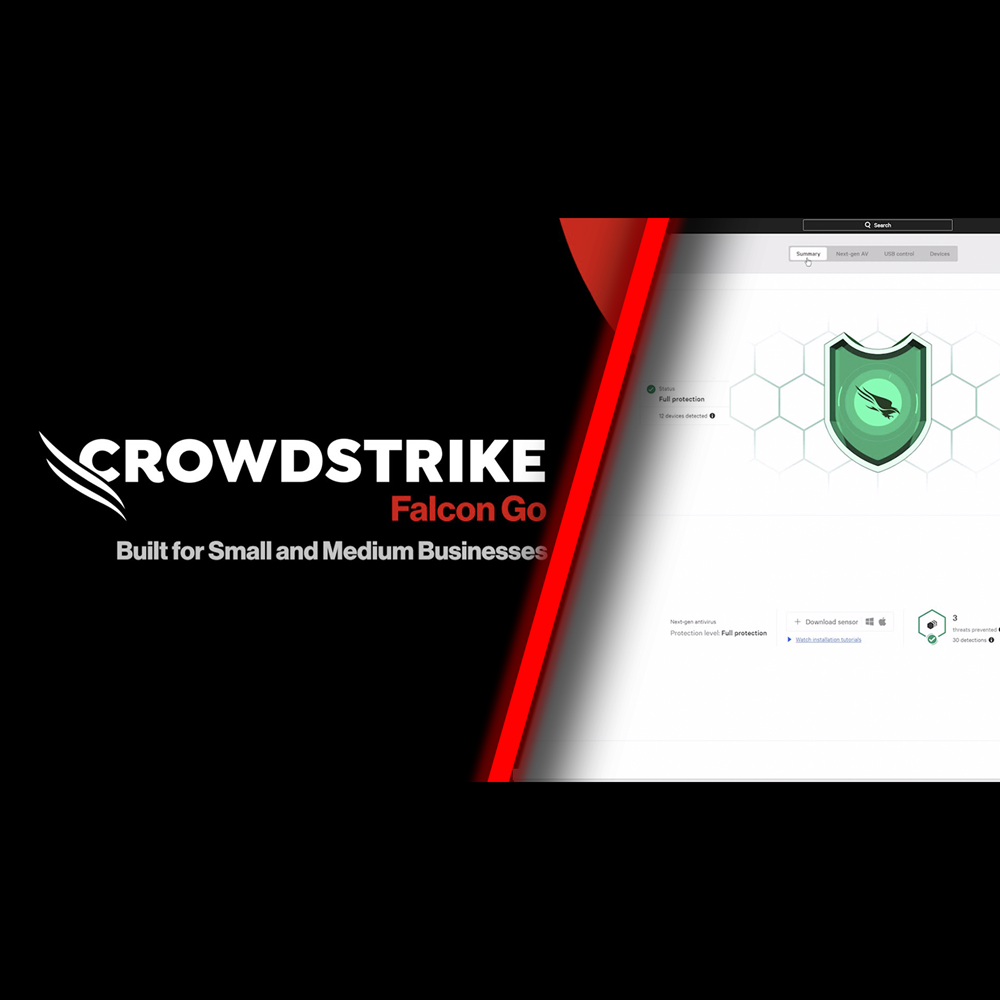
Play Video


Want to learn even more?
View all Endpoint Security content